In yesterday’s essay, I stated that I expect Electric Vehicles to be the driving force behind global copper demand increasing at 4.5% per year for the next 25 years.
While this might not seem like much, it’s actually enormous demand growth for a mature market. It translates into a nearly three-fold increase in global demand over the next 25 years.
If we believe annual copper demand is set to soar over the next 25 years, the next question we have to ask is, “Can the copper mining industry supply that much?”
The answer is “Yes, but not with copper at $3 per pound.”
We’ll get into the data below, but in preview, the world’s largest, most important copper mines – the ones that set the global copper price – are in decline. They have been in operation for decades, and their richest parts have been tapped. To use an analogy, most of the world’s big copper mines are like former all-star ballplayers in their late 30s and early 40s. They were great in their prime, but their ability to produce is steadily decreasing.
Existing mines still have plenty of copper ore, but it is less plentiful and it’s of lower quality (lower grade). In other words, it will cost more to mine each pound of copper mined in the future.
There are also some large undeveloped copper deposits in the world that can and will be put into production, but the shovels won’t start digging unless copper is substantially higher than current levels.
Surging demand. Limited supply. It’s a recipe for higher prices. Here are the details.
Ore Grades Are Declining
Currently, 178 producing copper mines supply 83% of the world’s copper. The remaining 17% of mined copper comes from secondary production where the main metal produced is not copper.
More than half of this mine production – 68% – occurs in mining-friendly or relatively mining-friendly countries. I often call these countries “non AK-47 countries.” In these places, you normally don’t see random people walking around cities with AK-47 machine guns. I count the U.S., Canada, Australia, all of Europe, Chile, Peru, and Brazil in this group.
About 32% of copper mine production occurs in AK-47 countries. These are places where it isn’t uncommon to see people walking around with AK-47s. The countries are known for not having great respect for contracts and property rights (and often human rights). They are not the kinds of places I’d take my family for a vacation. In my book, copper-producing AK-47 parts of the world are Russia, Congo, Iran, Mongolia, Saudi Arabia, and Kazakhstan.
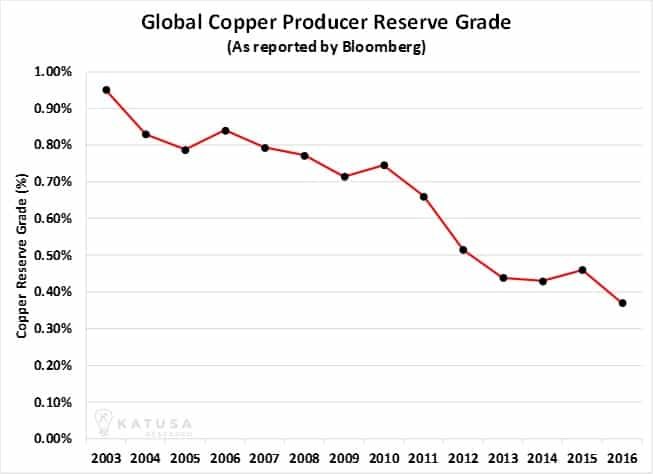
One of the best measures of a mine’s quality and potential profitability is a metric called “ore grade.” It measures how much metal a miner gets for every tonne of rock and dirt it digs up. The lower a mine’s grade, the more digging, and processing its operator must do to produce copper. This results in higher costs.
The chart below shows the average annual reserve grade of the world’s global copper producers. This group is made up of large miners you’ve likely heard of. Companies like BHP Billiton, Freeport-McMoRan, Antofagasta and First Quantum. As you can see, the average grade has declined 60% over the last 14 years. It’s an irreversible trend.
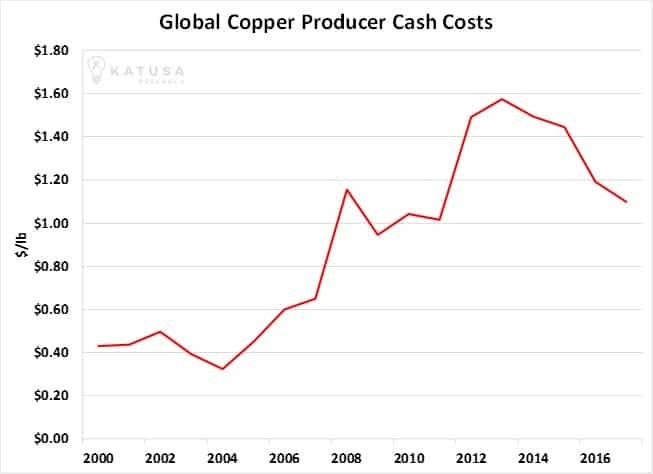
Increasing Production Costs
Declining grades are pushing production costs higher and higher. Below is a chart that shows the cash costs of production for the same group of global copper producers.
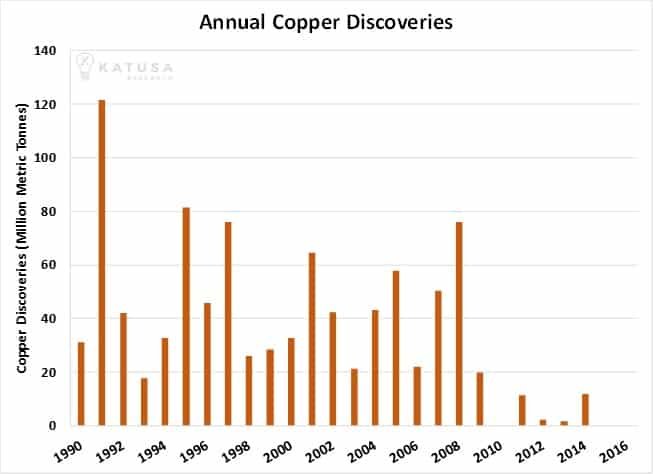
A Lack of Big Discoveries
In addition to falling grades and rising costs, the copper industry simply isn’t finding as many large new deposits as it used to. Mankind has been digging into the earth in search of copper for thousands of years. We’ve found most of the really good stuff.
Over the last 10 years, over $300 billion dollars has been invested globally in the exploration, development, and production of copper. And only a handful of new mines have been put into production.
The chart below shows how large copper discoveries have declined over the past 25 years.
Governments and Poor Infrastructure Constrict Supply Growth
In addition to the challenges above, the copper industry faces huge challenges from governments and poor infrastructure. These two factors often work hand in glove to increase production costs and slow down or stop new projects.
Operating a big open pit copper mine requires enormous amounts of electricity. It powers electric shovels and trucks. It powers the mills that crush the rock. It powers lights. Depending on the operation, electricity can be anywhere from 15-30% of the cost per pound of copper produced.
During the downturn of the last few years, electrical grids in many parts of the world that have advanced promising copper deposits (that should be soon in production) have not increased electrical capacity that can meet the demand from the copper mines. A general rule of thumb is for 100 million pounds of open-pit copper, a mine needs 65 MW of electrical capacity (an enormous amount of electricity). This is enough electricity to power 65,000 homes.
As the project gets bigger, the ratio improves by 15% for every additional 100 million pounds.
Many of the expected large copper projects that the market expects will come online shortly in Africa cannot tap into the existing electricity grid because there is simply no excess electrical capacity.
As a result, the potential copper mine will have to make up for the lack of electricity from the grid with their own, higher-cost sources of electricity, whether by installing diesel generators or by building their own power plants. In other words, the price of copper under $4 per pound doesn’t justify the infrastructure capex.
Also, expect certain countries in the third world to use access to the existing electrical grid as additional leverage for a piece of the profits at higher copper prices.
For example, in 2017, large copper producer First Quantum Metals was told by the Zambian government that the amount of electricity supplied to its copper operations would be reduced.
The Zambian government used electricity as leverage for a bigger piece of the project’s profits. But at the end of the day, this will result in a higher cost of production, because the company will either have to pay higher prices for electricity or install supplemental power sources at a much higher cost.
Another example of a government making life difficult for miners is the Freeport McMoRan/Indonesia story. Freeport is one of the world’s largest, most powerful miners. Its Grasberg operation in Indonesia is one of the world’s most productive mines. In 2017, Freeport was forced by the Indonesian government to reduce its stake in the operation from 91% to 49%. This was a huge setback for one of the world’s biggest miners. Freeport invested $12 billion into Grasberg to own 91% of it. Now it only owns 49%. To make things worse, Indonesia stated that if Freeport doesn’t invest another $10 billion within 10 years, it will lose its remaining 49% interest.
You can argue all you want about what is right and wrong when it comes to governments appropriating assets, but the result is still the same. When governments seize assets, it drives up costs.
Where Recycling Comes In
Copper is recyclable. Generally, it is not burned up like oil or natural gas. When analyzing the copper market, you must always factor in recycling.
I believe recycling will meet some of copper’s future demand, but even at $4.50 per pound, recycling met less than 20% of the demand. Recycling copper is a high-cost solution. Also, there are new restrictions on recycling copper in China that will increase the cost of recycling. There will be no flood of recycled copper to halt a sustained rise from the current price around $3 per pound to over $4 per pound.
What the Copper Market Will Look Like in the Future
Historically, global copper production has increased at an average rate of 3.42% per year.
To model what the supply/demand situation will look like in the future, I have run the numbers using annual demand growth of just 3.75% and annual supply growth of 3.5% (a little higher than its long-term average rate of growth). The chart below shows those projections out to 2040. You can see that production will barely keep up with demand until 2030, and then fall behind.
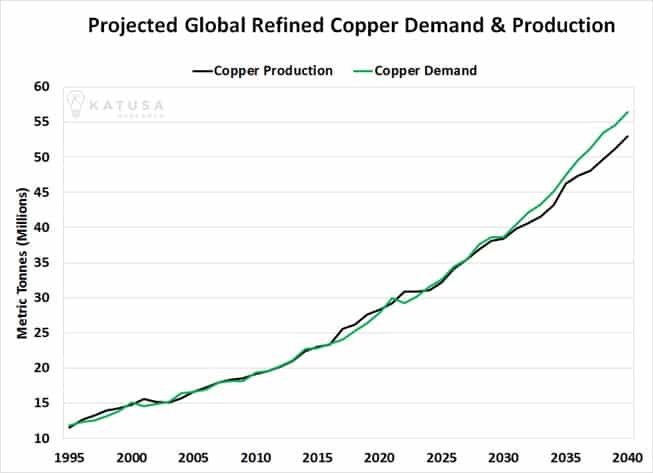
Again, the chart above was produced using conservative numbers. I believe in that conservative scenario, copper will reach $5 per pound over the next decade.
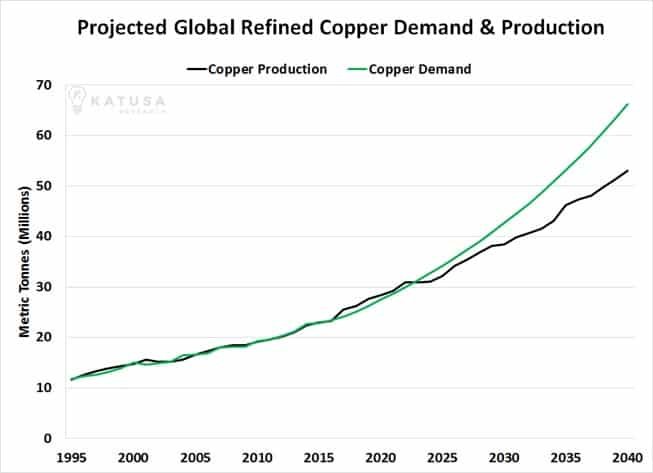
But it’s the next scenario that could make copper the world’s hottest commodity over the next decade.
As I mentioned earlier, I believe global demand growth could average 4.5% per year over the next 25 years.
If this happens, copper will be treated as a precious metal. There just is not enough copper in the world that can be economically mined under $5 per pound to meet global demand.
The major takeaway is that the tight copper market is going to become very tight over the next 60 months, after which copper demand growth will significantly outpace available production. I believe this will result in an incredible bull market for copper.
Just how big and profitable could this bull market be?
I’ll tell you in tomorrow’s essay.
Regards,
Marin