Gold’s Next Gear: 3 Charts Every Serious Investor Should See
Gold just posted its 6th best year in history and hit a new all-time high. And we’re only in September.
The last time we saw numbers like this were the 1970s—when Nixon killed the gold standard, oil embargoes shocked markets, and inflation ran wild.
Today, I’m showing you three charts that prove we’re in the middle of something massive. And major investors are now paying attention.
The Fed’s putting the bow on a gift to gold holders.
Let’s dive into the data…
Fed Rate Cuts Are Gold’s Rocket Fuel
Look at this 25-year history of gold versus Fed rates. Those green circles on the chart aren’t decorations—they’re wealth creation events.
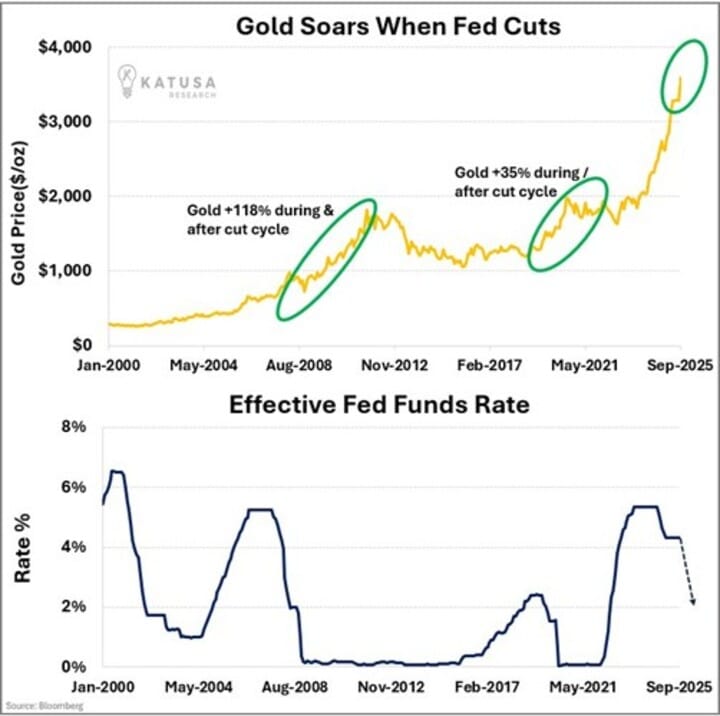
During the 2007 to 2011 rate cutting cycle, gold surged 118 percent.
In 2020 to 2021, another cutting cycle—gold jumped 35 percent.
Now check the right edge of this chart. Rates peaked and turned down. The dotted line shows where we’re headed.
This isn’t some wild theory. This is what happened—twice. When the Fed pivots from hiking to cutting, gold doesn’t just rise. It explodes.
The mechanism is simple: when rates drop, the opportunity cost of holding gold drops. When they print, gold wins. Every. Single. Time.
But here’s what most investors miss: we’re not just entering another rate-cutting cycle. We’re entering one with $37 trillion in government debt that needs refinancing. Every basis point the Fed cuts saves Washington billions.
It’s not just looking at monetary policy changes anymore—we’re in fiscal survival mode.
We’re In A 1970s-Style Gold Boom
The greatest gold years in history all happened in the 1970s. Every single top-five year on record.
This chart should stop you cold.
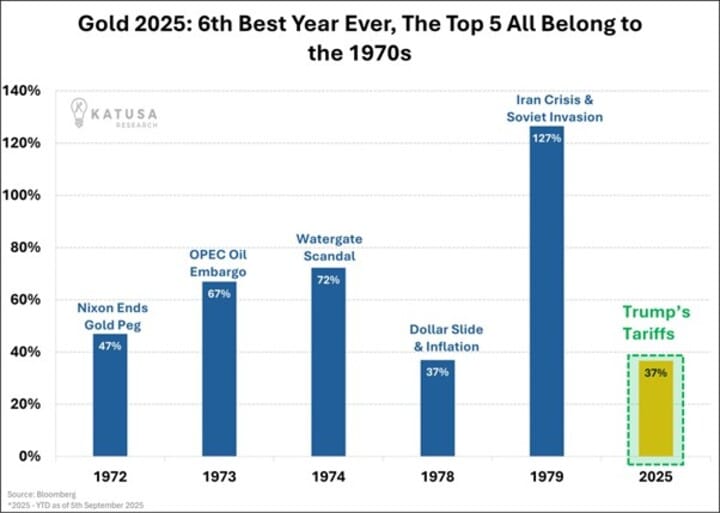
Nixon ending the gold peg: 47%. OPEC oil embargo: 67%. Watergate scandal: 72%. And the biggest—Iran crisis plus Soviet invasion: 127%.
Now look at 2025. As of September 5th, gold is up 37% year-to-date. That already makes it the 6th best year on record. We’re matching 1978’s performance—with four months still to go.
Here’s the kicker: Gold doesn’t rally on good news. It rallies when empires crack. When systems strain. When trust breaks.
The 1970s taught us that. And the numbers say we’re living through something similar right now. Except this time, it’s not just an oil crisis or a political scandal. It’s a global monetary reckoning decades in the making.
North American Money Changes Everything
This is the smoking gun.
ETF flows by region tell the real story. Blue is North America. Red is Europe. Green is Asia.
From Nov 2024, North America flipped to steady net buying—lifting total flows—while Europe/Asia stayed choppy.
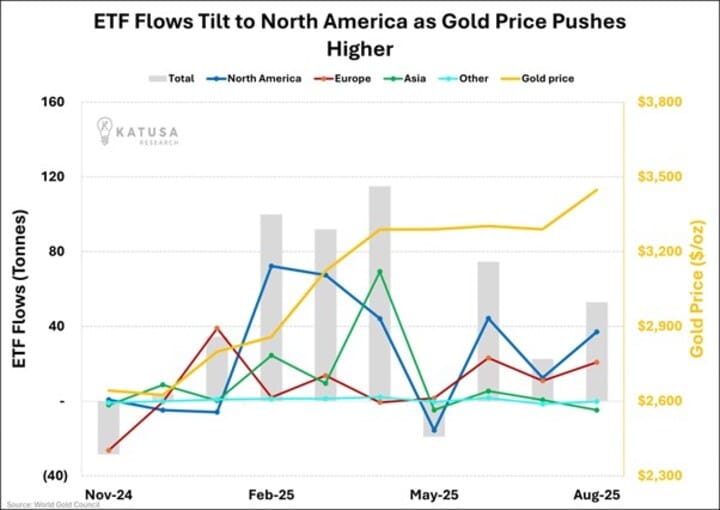
Meanwhile, Europe and Asia? Choppy. In and out. No conviction.
But North America? They’re buying every dip. And every rip.
Total flows turned positive—those gray bars—and North America is doing all the heavy lifting. This shift happened fast, and it’s accelerating.
When the smartest institutional money on the continent flips from seller to buyer, you pay attention. But it’s not just the suits piling in…
The Costco Validation
Want proof this is real and goes beyond Wall Street?
Check this out…
Gold in Canada just hit $5,000 per ounce. And Costco—yes, Costco—is completely sold out of gold coins and bars. Across the entire country.
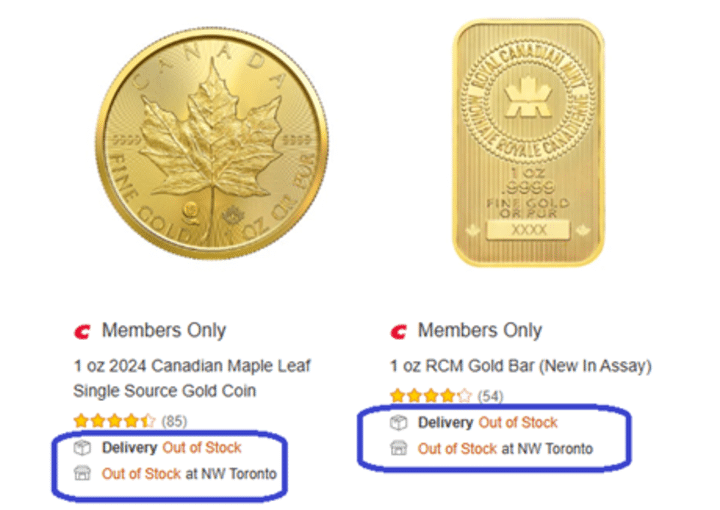
Think about that. The place where you buy bulk toilet paper can’t keep gold coins in stock. Canadian Maple Leafs. Royal Canadian Mint gold bars. Gone.
This is Main Street. When regular people are clearing out Costco’s gold inventory, you know something’s shifting.
The institutions showed us the move in those ETF flows. Now retail is confirming it at the checkout counter.
The setup is clear. The money is moving. The shelves are empty. And history suggests what comes next.
We’re at the beginning of gold’s next gear.
Regards,
Marin Katusa
Details and Disclosures
Investing can have large potential rewards, but it can also have large potential risks. You must be aware of the risks and be willing to accept them in order to invest in financial instruments, including stocks, options, and futures. Katusa Research makes every best effort in adhering to publishing exemptions and securities laws.
By reading this, you agree to all of the following: You understand this to be an expression of opinions and NOT professional advice. You are solely responsible for the use of any content and hold Katusa Research, and all partners, members, and affiliates harmless in any event or claim.
If you purchase anything through a link in this email, you should assume that we have an affiliate relationship with the company providing the product or service that you purchase, and that we will be paid in some way. We recommend that you do your own independent research before purchasing anything.