The outcome leaves you baffled and confused…
No matter the language or culture, magicians have performed sleight of hand tricks to wow audiences around the globe for centuries.
The magician’s goal is to reveal a chosen reality to the audience, while concealing the real methods and actions that bring the magic trick to life.
Two important factors play into sleight of hand…
The first is misdirection, which focuses the audience’s attention on something of no significance, drawing all their attention away from the trick.
The second factor is the slick alteration of an object or sly movement that’s nearly impossible to detect.
Economists – especially those that track inflation statistics – are specialists at sleight of hand.
Now you see it… and now you don’t.
Economic Inflation Magic
According to TradingEconomics, the annualized inflation rate in the U.S. was 1.7% in February.
But if you’re wondering just how much your grocery, restaurant, car, insurance, energy, renovation, or other bills are rising higher and higher by (especially over last year), there’s one chart that can tell you where to look…
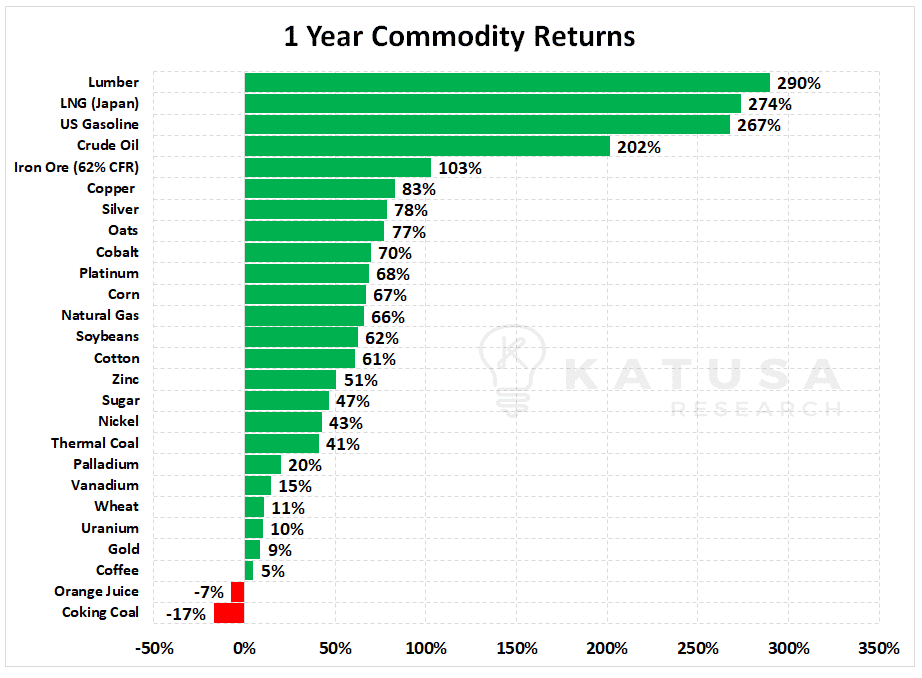
Over the last year, commodity returns were overwhelmingly positive.
And many have experienced very large % increases.

With these massive price appreciations, is it feasible that prices continue to go even higher?
Did we just see an inflection point where the trend accelerates and we hit supercycle status?
The Inflation Indicator that Actually Matters
When you mention inflation, the first thing that comes to the mind of most investors, novice and veteran alike, is the CPI.
You probably already know the CPI as the Consumer Price Index, a widely watched measure of inflation.
But if you’re a resource investor…
- You should be paying attention to the Bank of Canada’s Real Commodity Price Index
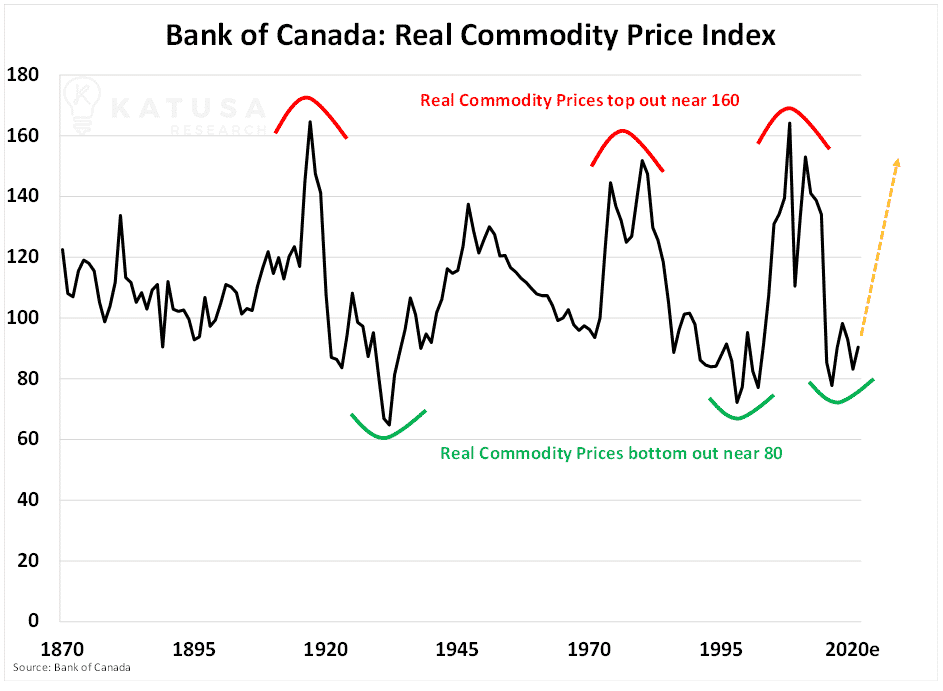
The BoC’s CPI is a commodity price index that encompasses the energy, metals, agriculture, fisheries and timber markets, all combined into 1 representative index.
Below is a chart which shows the commodity price index going back to 1870. You’ll find that we’re near the lows in real, inflation adjusted terms for global commodities.

Let alone surpass them and create new highs for commodity prices in real terms.
Major price movements in commodities aren’t based on “technical breakouts or breakdowns”. Instead, they’re based on supply and demand fundamentals.
Answering questions like “is there enough future supply to sustain demand?” present major clues to potential upcoming moves in the commodity space.
Future supply cannot be created out of thin air.
It starts with long, hard and usually unsuccessful exploration activity.
Financing (and Making Money From) Future Demand
Math matters.
Understanding the risks associated to a project and properly adjusting the valuations to reflect the real risk associated to the project is critical to be successful in mining.
Like I said, math matters. And most in the business flat out suck at it.
- This is the number one mistake in the mining business today—hands down—and NOBODY is talking about, except Katusa Research.
There is no way you can price the risk for a project in the DRC or Argentina the same as a permitted deposit in Ontario or BC or Nevada.
But yet, the big brokerage firms do just that.
Why?
Because they are in the business of selling you paper. And pesky details like risk adjusted analysis makes it very difficult for the bankers to sell paper.
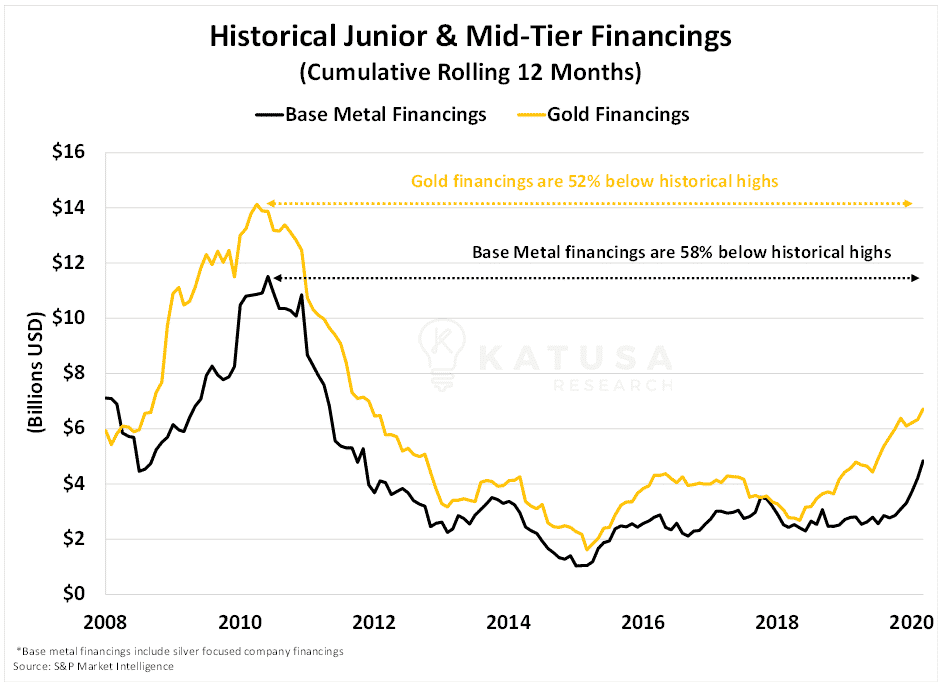
Below is a chart which shows equity financings for junior and mid-tier gold and base metal companies since 2008.
- You can see that financing levels are down over 50% from their highs.

Less money raised means less exploration and development work on delineating new gold or base metal mines.
- Less mines mean lower future supply. And lower future supply is bullish for long term prices.
Why don’t we just build more mines and create more supply, you may ask.
It’s not that easy…
How Long Does it Take to Build a Mine?
Answer: A long time.
If the company is successful at finding a good deposit – and many aren’t – it can take over 10 years to develop a mine from exploration.
Then get permits. And then finance and the build the mine.
How many gurus who talk about mining stocks have actually put their name and money to a mine like joining the board of directors?
How many gurus in the mining space who write newsletters have done that?
I have.
I was the largest individual investor in Copper Mountain (CMMC.TO) when we took the company public in 2007. And was a member of the Board of Directors from concept in early 2017 exploration to becoming Canada’s 3rd largest copper producer.
I retired from Copper Mountain 13 years to the day of joining.
Jim O’Rourke and Rod Shier don’t get enough credit for the incredible job they did on Copper Mountain—but those who know, know.
- Copper Mountain went from idea to mine in 4 years. That’s a very rare event. It’s also a ten bagger over the last 12 months.
Go CMMC Go!
Realistically, building a mine from exploration if the management have actually found a deposit is closer to 15 years to put a mine into production.

Now let’s take a closer look at the copper market…
The price of copper can affect everything from the cost of plumbing in your home to the cost of an electric vehicle.
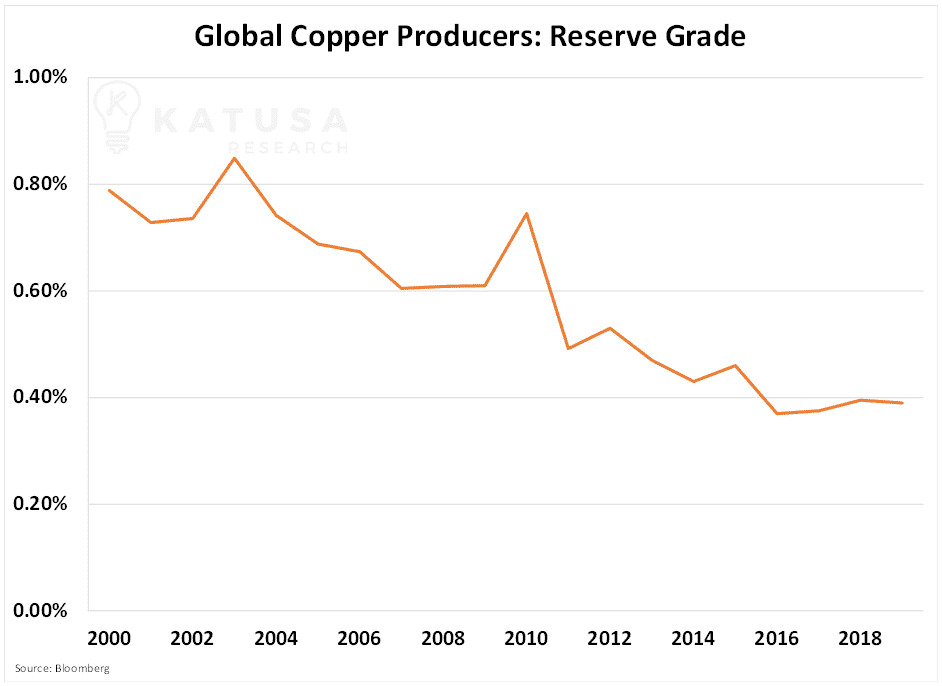
Below is a chart of the Bloomberg Global Copper Producers average reserve grade.

- Miners are obtaining half the copper from a ton of ore, relative to twenty years ago.
The Big Boom
High prices are only sustainable through a boom in commodity demand.
With close to $10 trillion printed around the world, governments are doing their best to prop up and energize their economies.
This much printing of money creates a somewhat artificial increase in prices. But tangible and sustainable price appreciations in commodities must come from fundamental demand and supply metrics.
- Electrification of the economy will play a key role and will be a central determinant in if this “supercyle” is the real deal…
Or if this is simply a one-year hurrah followed by a subsequent bust.
I believe that this time around, a rising tide will not lift all boats.
Some commodities are destined to be in bear markets forever.
Substitution risk amongst commodities is incredibly high, yet it’s disregarded by many “gurus” and analysts.
That’s why I’m just putting the finishing touches on a very important upcoming report:
- I will be detailing where I believe the true boom in commodities is going to be, to my subscribers.
If you’re looking for a way to get invested in the commodity space, Katusa Research provides comprehensive and actionable advice.
I’ve been in the industry for 20+ years, financed 100’s of deals and invested millions of dollars into commodity focused businesses that I believe can generate incredible returns.
If you want to get ahead of the curve, click here to find out more about Katusa’s Resource Opportunities.
Regards,
Marin Katusa


