
Market intelligence
Katusa Market Intelligence Center
Free market data, live charts, and every Canadian and US resource financing the moment it files.
All of it is free to use, and none of it is a recommendation. It is a starting point for your own research.
- Gold+6.6% 1y$4,169/oz
- Silver+29.1% 1y$61.43/oz
- Copper+31.3% 1y$6.64/lb
- Uranium−19.0% 1y$40.19 ETF
- Bitcoin−30.4% 1y$85,939
- Corn+18.7% 1y$498/bu
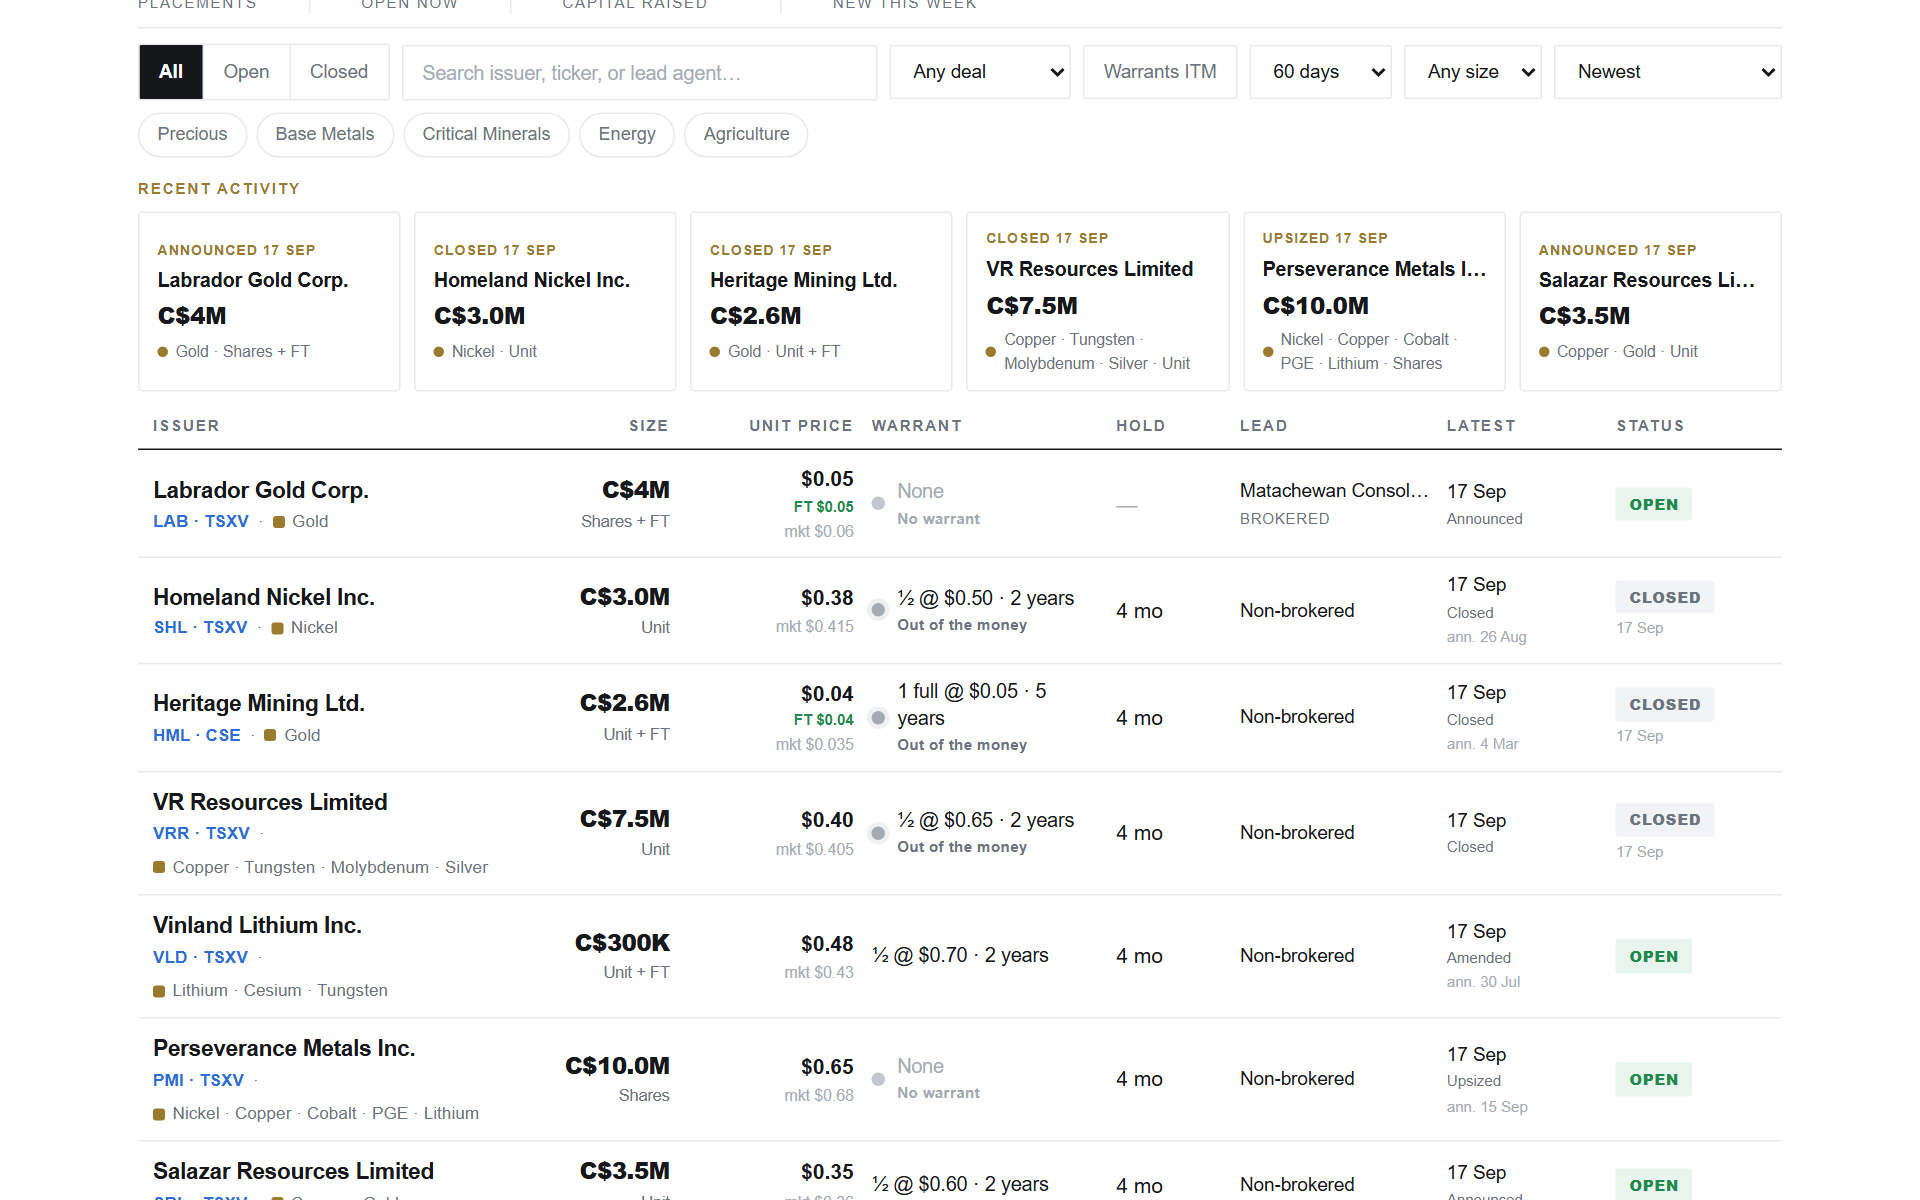 FinancingsPrivate Placement MonitorEvery Canadian and US private placement the moment it files: issuer, raise size, pricing and terms, straight from public filings.Open the Monitor →
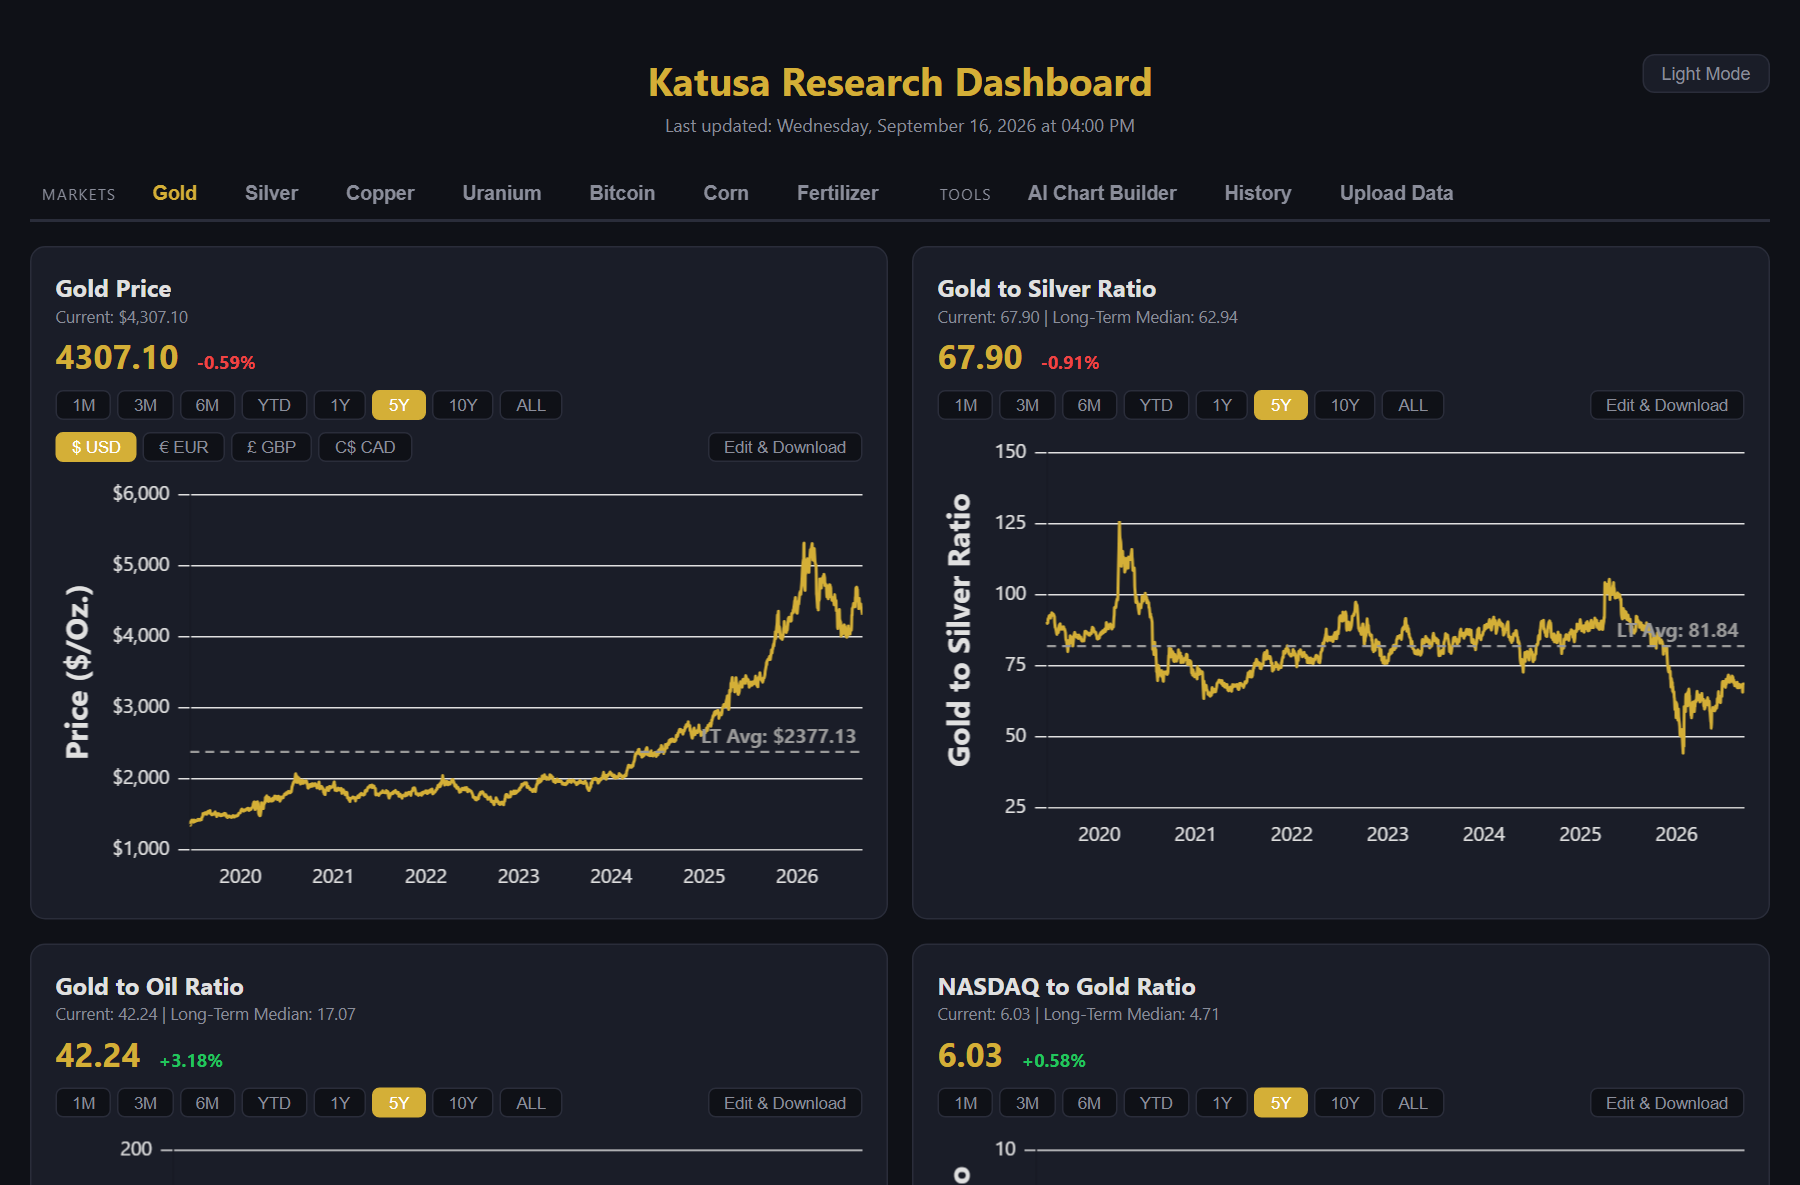 Live chartsMarket DataInteractive charts for gold, silver, copper, oil, uranium and bitcoin, or build your own from almost any ticker.Open Market Data →
- CommoditiesCommodity Bargain MonitorThree-year trailing returns across the major commodities. Anything down more than 50% lands on the radar, which is where out-of-favour assets hide.0 of 16 on the bargain radarOpen the Bargain Monitor →
- Gold and bitcoinBitcoin vs. Gold Market CapDigital gold against the real thing, tracked side by side since bitcoin was worth rounding to zero.5.9% Bitcoin as a share of goldSee the chart →
- Gold and macroGold / S&P 500 RatioGold priced in the S&P 500: one of the clearest reads on whether hard assets are cheap or expensive against stocks.0.54 21% below its long-run medianSee the ratio →
- ValuationBuffett IndicatorUS corporate equities as a percent of GDP. Buffett called it the best single measure of where valuations stand at any given moment.255.1% as of Apr 2026See the indicator →
- ValuationShiller PE RatioThe cyclically adjusted price to earnings ratio, smoothed over ten years of real earnings and tracked back to 1881.40.58x as of Sep 2026See the CAPE chart →
- CreditHigh-Yield Credit SpreadWhat the junk-bond market charges over Treasuries. The fastest read there is on whether credit is calm or frightened.3.24% as of 1 Oct 2026See the spread →
- CreditBank Lending StandardsThe net percent of banks tightening standards on commercial loans, from the Fed senior loan officer survey. Above zero, credit is getting harder to get.0.0% as of Jul 2026See the survey →
- PositioningUS Household Equity AllocationHow much of US household financial assets sit in equities, back to 1945. High allocations have historically preceded weak long-run returns.48.2% as of Apr 2026See the allocation →
- Gold and silverGold / Silver RatioHow many ounces of silver buy one ounce of gold. The oldest gauge in precious metals, tracked since 1970.67.9 8% above its long-run medianSee the ratio →
Prices and ratios are the latest close from the Katusa chart service. The valuation gauges are quarterly and monthly series and each one carries its own as-of date.