This past week I was invited to be a keynote speaker at Rick Rule’s Sprott Natural Resource Symposium.
And every year, gold is a key topic on everyone’s mind.
Let me remind you of a very old saying…
Gold is the Currency of Kings
Silver is the Currency of Gentlemen
Barter is the Currency of Peasants
Debt is the Currency of Slaves
In the long run, I’m very bullish on gold. But like all commodities, gold is very cyclical.
The price of gold and other important data I’ll show you in a moment is something I’m paying very close attention to through my holdings.
I’ve written big checks and made big buy orders on assets that I believe are very cheap and well-priced in today’s currency commodity markets.
These are the types of companies I want to own. Why? Because I believe a major will want it in its portfolio in a few years. And all for reasons, I’ll explain further down in this missive.
Marin – Is the Commodity Bear Market Over?
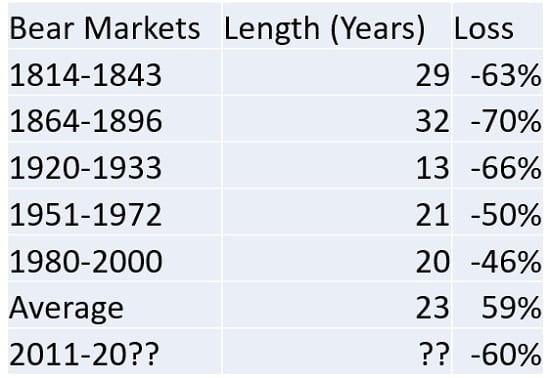
It’s no secret that we’ve been in a commodities bear market for the better part of this decade. But just because the commodity bear has gone on for a long period of time, doesn’t mean that it’s over.
Far from it.
These bear markets can last for much longer than a speculator can remain solvent. As you’ll see in the table below, the current loss is right near the average loss for recorded bear markets.
But when the market turns around (and it will) as shown in the next table, the average gains across commodities become astonishing.
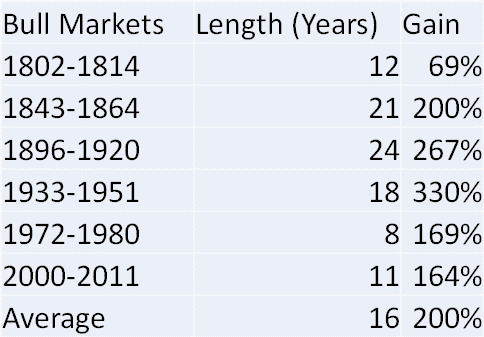
And any investor or speculator that’s been around the resource markets for a couple of years knows the famous line – but wait, there’s more. The share price of individual commodity stocks are highly leveraged to the price of the underlying commodity. And this causes the share price of the commodity stocks to soar many times higher. It’s where you see spectacular gains of 500%, 1000% and even 10,000%.
To ride out any long downturn, I put all the companies that I hold through extensive stress tests. I do this to determine which will survive in a worst-case scenario. You need to do the same.
But you can make a tidy fortune in a Bust and even the Echo that follows. This is the period of time where stock and commodity prices are flatlining and only the best stories can make you multiples on your investment.
In the chart below, you could say that the gold price has been in an Echo phase since 2016…

This is How You Make Money in Today’s Stage of the Commodity Cycle
At this point, there isn’t crazy interest in commodities. But this is good because it allows you to pick up great assets for even greater prices.
When there is interest in commodities, it’s speculators and investors that will bid up stock prices to crazy valuations (like blockchain, cobalt and marijuana booms that happened more recently).
But when there’s little buying interest from the crowd, there will always be interest from another buyer – a larger company looking to increase their portfolio of projects.
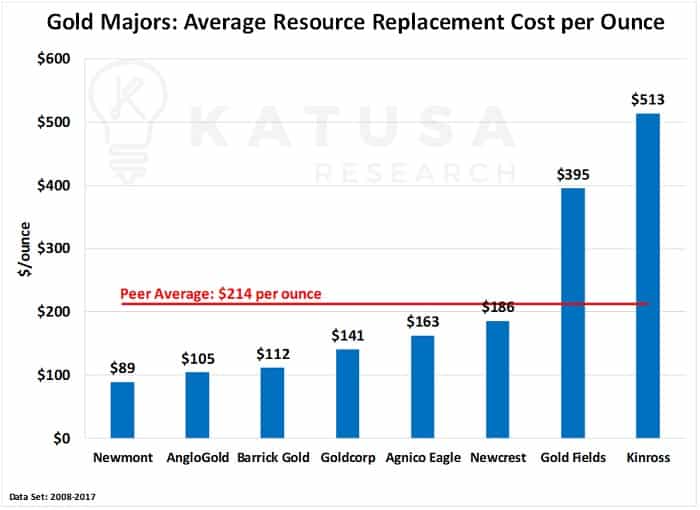
What’s bad for gold miners could be very good for gold stock investors for the next few years. Simply, gold miners are running out of gold and they need to replenish their reserves.
They’ll do this by looking for gold in the markets. They’ll go on a buying binge to take out small and mid-cap companies with proven gold reserves.
Why? In the chart below, you’ll see that it’s expensive for some large gold companies to replace their gold production.
One of the things any business needs to know is its cost of acquisition.
How much does it cost a restaurant to get someone in the door? How much does it cost an accountant to gain a new client?
In the chart below, you’ll see what the real cost is for majors to buy gold.
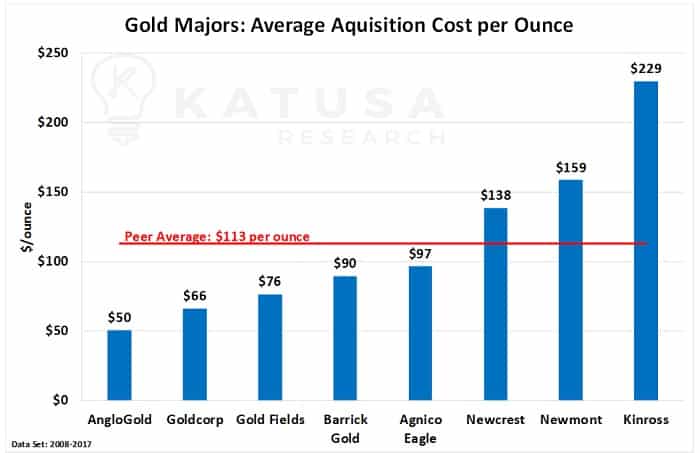
On average, it takes $113 for these majors to secure an ounce of gold.
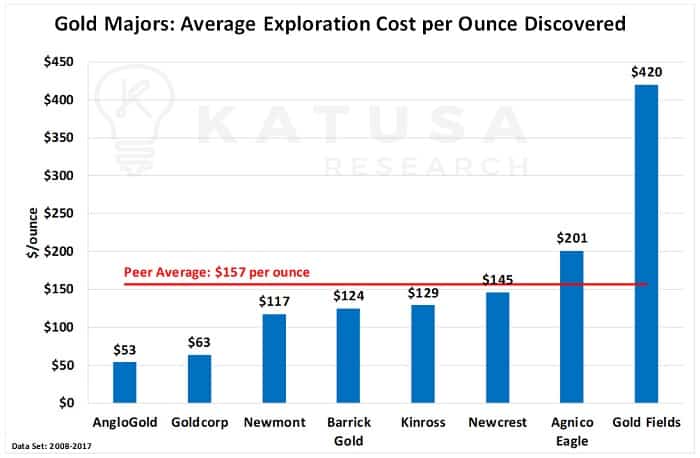
Gold majors also need to know what is the exploration cost per ounce discovered. In the chart below you’ll see what this cost is for many of the large gold companies.
And in 2018, it’s estimated nearly $4 billion is being spent on exploring for gold…
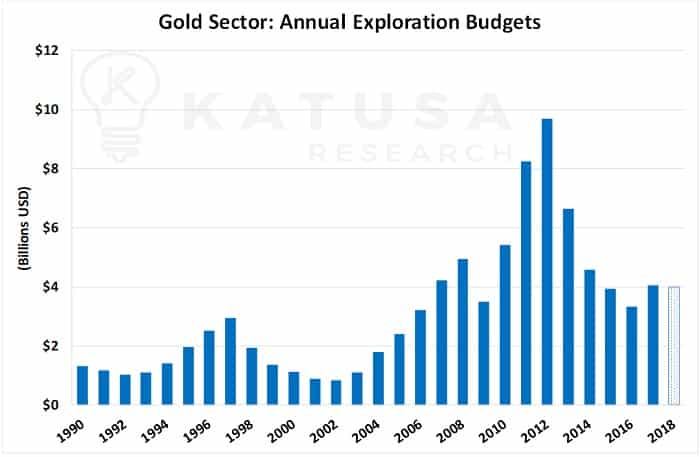
You can see that more money is spent on exploration near the peak of gold bull markets (like the recent one around 2011). But exploration budgets are proving steady in this Echo phase.
Gold Companies Raised Billions – Where are the Dollars Going?
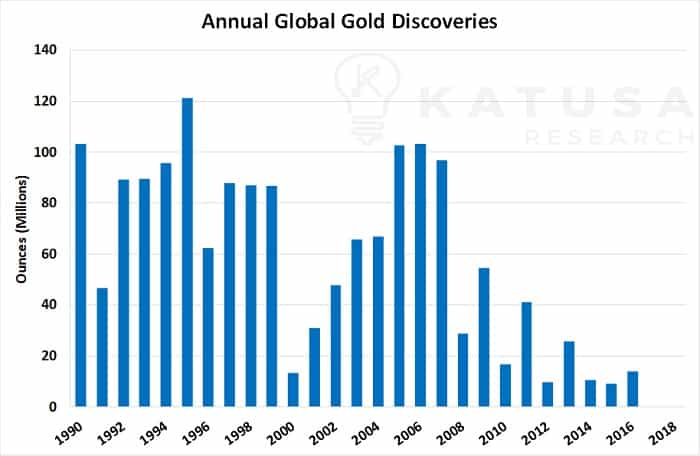
Almost $10 Billion dollars of exploration has been spent in the last 24 months without a new major gold discovery. Compare this to 1990 when almost 100 Million ounces of gold was discovered with less than $2B in exploration.
So, have geologists and exploration teams become more useless over the last 30 years, or perhaps is the “easy” gold found?
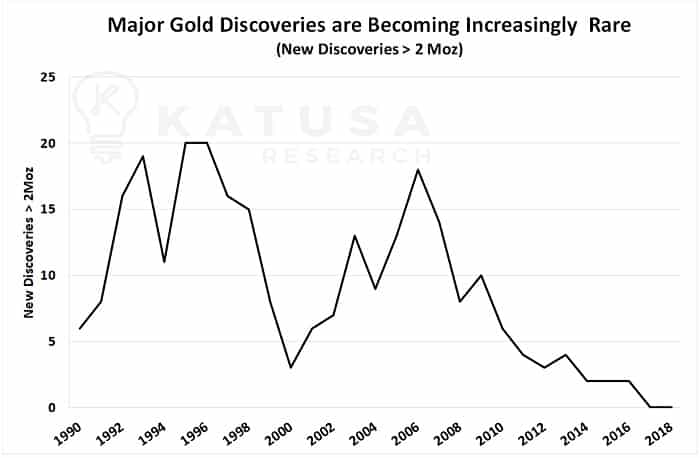
There are no two ways about it. The chart below paints a bleak picture. It shows that annual gold discoveries are decreasing…
Now, we can overlap the charts to really see the effects of the money spent and how much gold has been discovered…
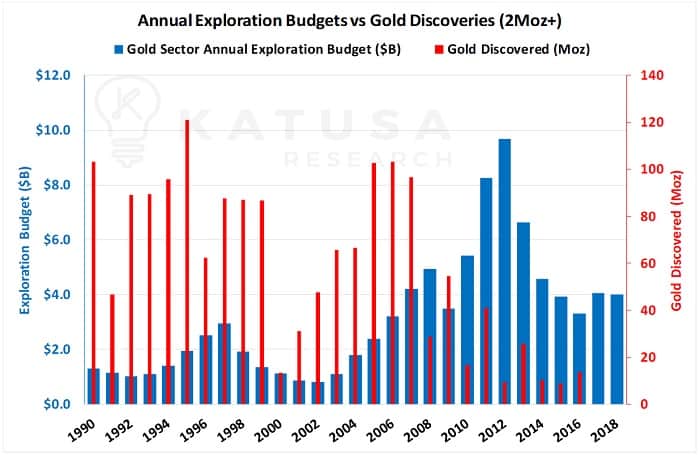
It’s no wonder shareholders of many gold stocks are pissed off. Management teams are not finding new deposits. Is it that their luck is just off? Or are the geologists terrible at their jobs? I don’t think that’s true for most companies (but definitely for some).
In the chart below, you’ll see that gold discoveries greater than 2 million ounces (i.e. enough to make a big splash) are becoming increasingly rare…
The Gold Price and Effect on the Bottom Line of Gold Majors
The decline in the price of gold (now hovering around $1225) means less revenue for gold companies.
It also means they’ll have less money to spend on project development and exploration.
Since 2012, we have seen the exploration budget for the major gold companies decrease from nearly $4 billion down to $2.2 billion currently. The chart of annual exploration budgets for the majors is shown below.

Major gold companies need to beef up their reserves by purchasing the best projects owned by smaller gold companies. But those projects need to move the needle for a major.
Small projects need not apply. Shareholders will demand growth and they need to listen or they’ll start to see their investors look for the nearest exit.
However, the elephant in the room is the Reserve Life Index. The Reserve Life Index is the expected number of years a company can continue to produce gold given its current gold reserves. It’s a back of the napkin calculation but it’s a reasonable indicator. The average major gold producer’s Reserve Life Index has declined should have at least 8 to 10 years of reserve life.
The chart below shows the major producers’ reserve life index. The average Major Reserve Life Index has decreased by 40% over the last decade. That is not a good thing.
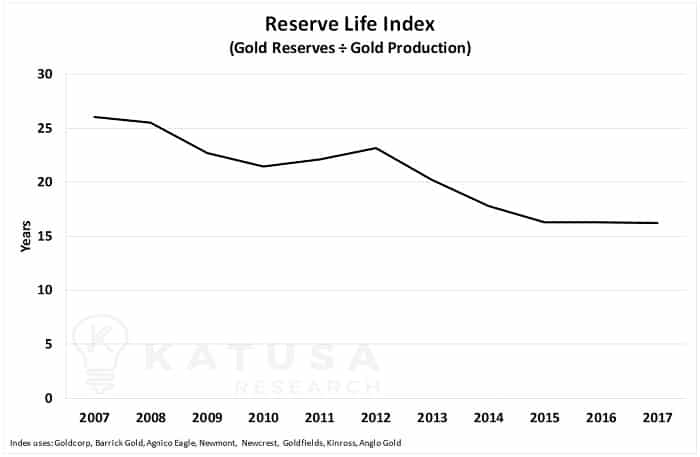
At current levels, the average reserve life is 16 years. This may seem like a long time, but it’s not. Consider that it takes on average about 10 years to bring a new mine into production.
What keeps the majors up at night is the next chart. It shows that the average grade of production of the gold mines has decreased by 31% over the last decade. As you’ll see, both total production and average reserve grade have decreased.
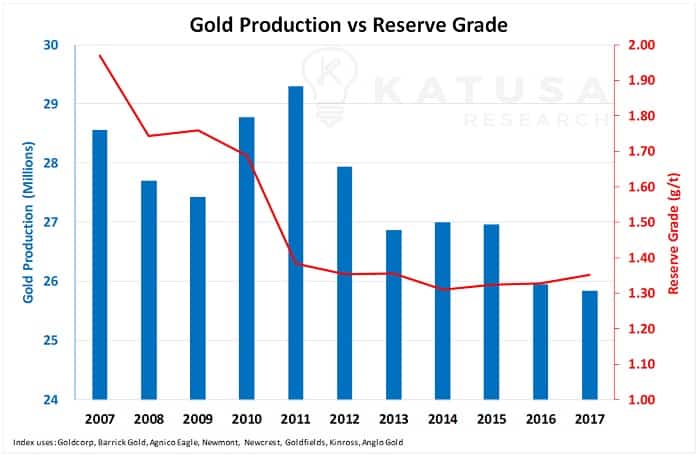
This to me is a bigger issue for the majors than the Reserve Life Index.
Since 2007, the average grade has decreased from 1.97 grams per ton to 1.35 grams per ton. This is a drop of 31%.
It’s a simple fact that if you have two identical gold mines, one with high-grade ore and one with low-grade ore, the high-grade mine is going to produce more cash flow.
As companies run out of high-grade operations, they are forced into building lower grade projects. This makes a smaller producer or developer with a high-grade project that much more valuable.
Regards,
Marin
P.S. Right now, I am putting the finishing touches on my next report, where I analyzed over 600 producing gold mines and 2,500 development stage gold projects to uncover the next takeover targets. It’s a surprisingly short list of companies that I believe are suitable projects for gold majors and mid-tier producers. To gain access to my report where I reveal the names of those select stocks, you need to become a member of Katusa’s Resource Opportunities.


