Market Commentary
As I stated last week, the quick pop above $50 in the price of crude was overdone and was met with selling this week as the oils closed down back in the mid-40s. The markets are incredibly volatile, in my funds right now my focus is either very short term trades when I can find liquidity or structuring big deals with 5 year warrants that will allow me to ride out the whipsaw.
What’s on my radar this week?
I just got back from many site visits which included a research trip in Africa with Lukas Lundin, Keith Hill, and the best energy analysts in the business.
Inspired by last week’s rally in the price of crude, I break down the US and Canadian Bakken players. The Bakken is one of the most prolific and important oil producing regions for both countries. My suspicions were confirmed that none of the producers can be free cash flow positive in the low-40s while only several can make money above $50 a barrel.
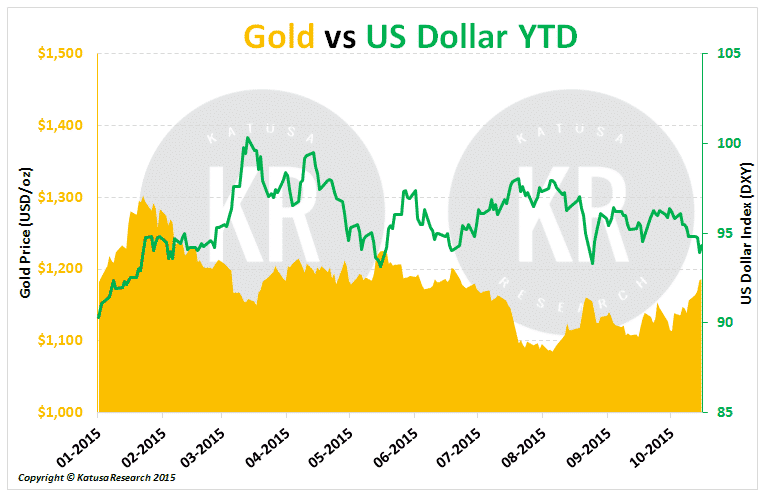
Gold has led the charge higher in the resource markets due to the weakening in the US dollar. I have also provided my favorite charts on gold as well for you this week.
Battle of the Bakken
Can the oil companies who produce oil in the Bakken survive at $40 oil? What about $50 oil? What about $60 oil?
That’s the subject of this week’s missive along with some flavor for the gold bugs.
Last week, everyone got very excited about oil’s rise back up to $50 a barrel and as a result of the move in oil, equities popped considerably. But were the gains in stock prices truly justified?
No.
Why? Because most E&Ps don’t generate positive free cash flow, no matter whether the oil price is $47 or $51.
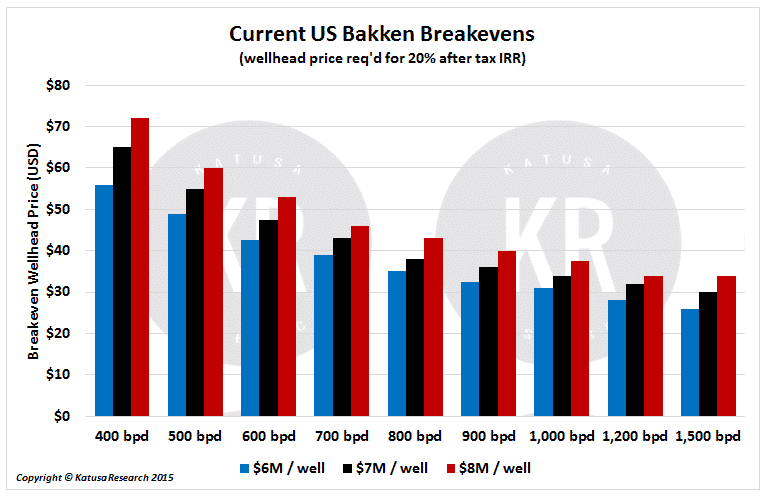
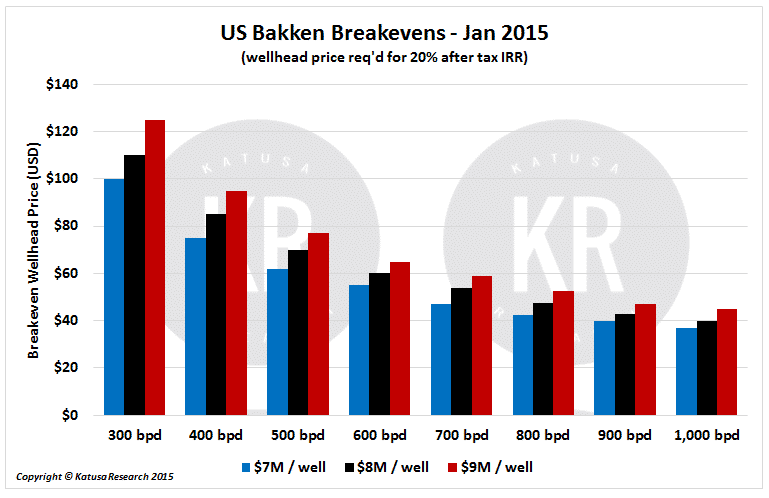
Below is a chart that represents the initial 30-day production required to provide a 20% after-tax IRR in the US Bakken- region. Following that is a chart of the first round of these calculations, from an earlier report done in January 2015. (‘AT’ stands for After Tax, and I use a 20% IRR because, as a general rule of thumb, that’s the minimum rate of return you need to cover all the costs and risks in the oil patch.)
What Does This Mean?
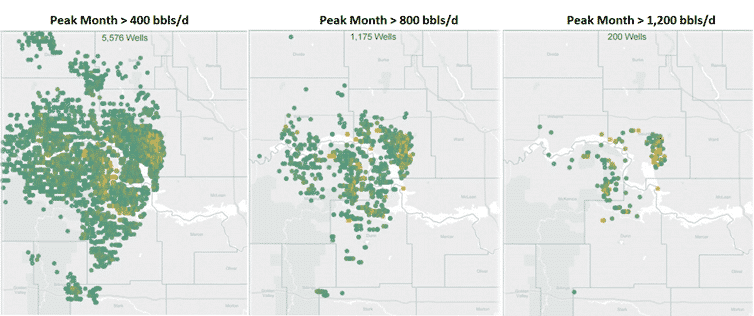
Basically, if you think you will make money on companies producing sub-400bopd wells, the harsh voice of reality will be speaking to you soon.
The change is very impressive, but let’s not get too carried away. Even if a company’s well is in “core” Bakken acreage, that still is not enough. Of the 5,576 wells that produce more than 400 barrels per day, less than 25% of those yield upwards of 800 barrels per day, the approximate production figure required to generate that coveted 20% after tax IRR.
Let me repeat that key statistic: Less than 25% of the wells in the core of the US Bakken produce oil from wells that return 20% IRR after tax. Is the company you are invested in earning 20% IRR?
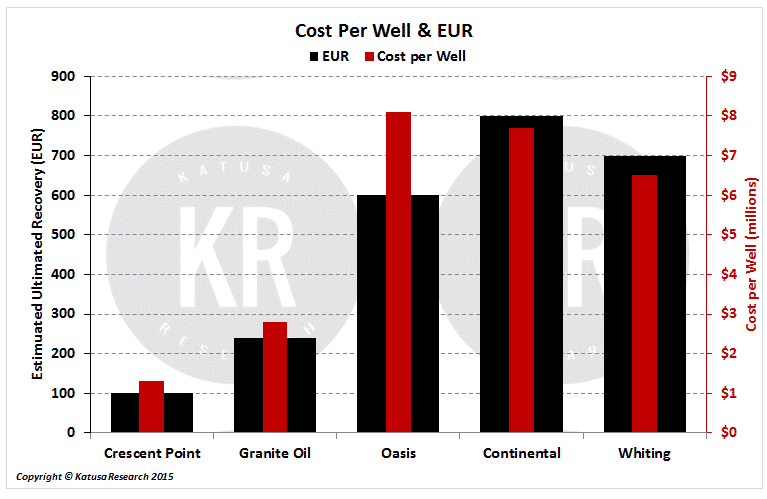
Excess is synonymous with the US and that applies to their US shale wells. Canadian Bakken wells are dwarfed by US shale wells the hold 3-8 times the reserves and cost 2-6 times more per well.
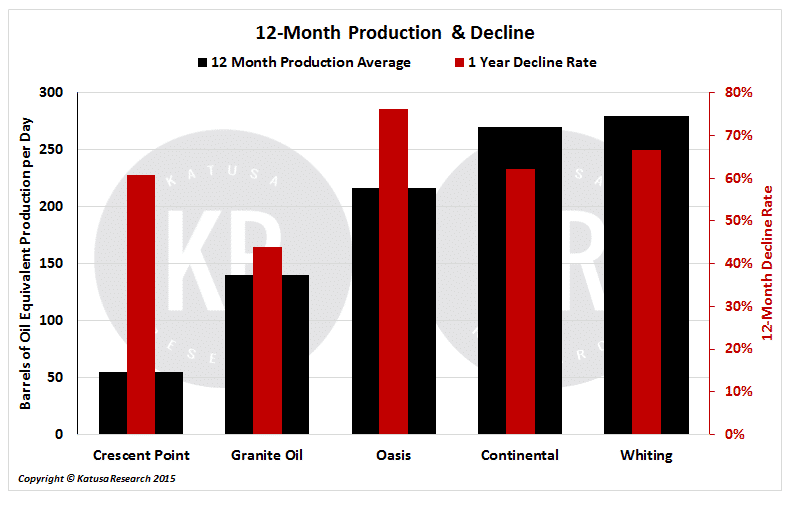
The extent of the Boom-Bust in the Bakken is most accentuated in the US because of high well costs and decline rates. The average 12-month decline rate for a US Bakken player is 68% vs. 55% decline of the average Canadian producer.
What About Canada’s Bakken?
Taking this a step further, an oil field doesn’t understand international boundary lines and as such we can directly compare Canadian and US Bakken producers on a total cost basis. We need to look at all operational costs, as well as capex plans and dividend outlays, to arrive at an accurate total cost number. A realized price above that number is what a company truly needs to attain a positive free cash flow.

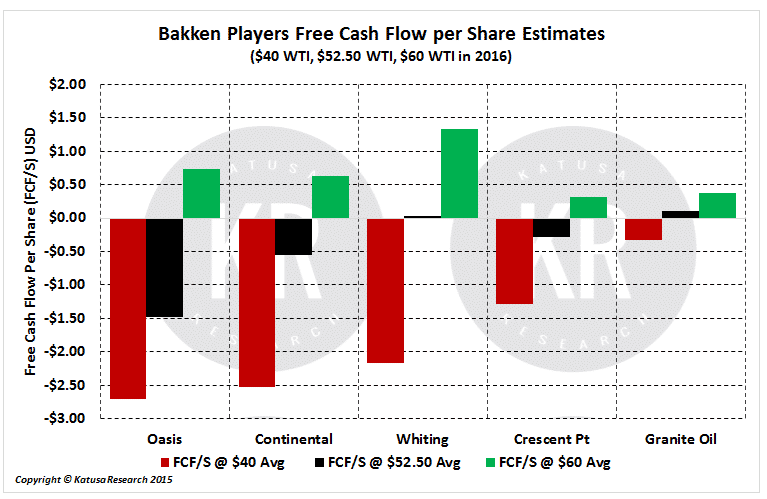
Using last week’s strip for 2016, the average WTI price is approximately $52.50. Oasis, Continental and Crescent Point will all lose money on a free cash flow basis at the strip price.
That doesn’t appear to be the case, for example, with Continental. It looks as though they would generate free cash flow even at $40 because $40 WTI is greater than the company’s total costs. However, they do not realize the full $40 per barrel, for several reasons:
- First, most Bakken oil wells do not produce 100% oil, as they also produce gas, and as a result the average realized price of total production will be less than the price of oil.
- Second, pipeline constraints coming out of the Bakken create a price differential as Bakken producers are forced to take a discount to WTI. Continental Resources had an $8.18/barrel difference from the NYMEX average price in Q2 2015.
The following chart gives a better picture of the real situation on the ground. As you can see, three of the five companies still lose money at $52.50 oil, while the margins of the other two are razor thin.
The Canadian oil producers also have the gift horse of a weak currency, which helps make up for lower commodity prices. But they are not out of the woods either. Many have some serious issues like debt, cash flow, free cash flow, and dividends at risk.
The point is, even top tier names in the US/Canadian Bakken will struggle to generate free cash flow at current prices. To make things worse, I think the share prices of many of the Bakken producers have not fully factored in the lower-for-longer oil price environment that the market is only beginning to come to grips with.
For now, my money is staying away from the Bakken.
All That Glitters
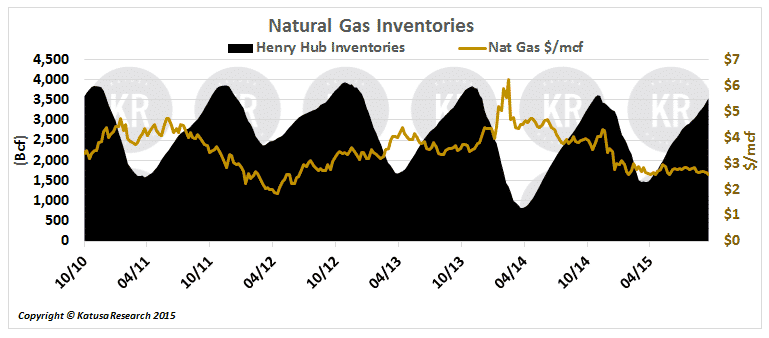
Gold on the other hand is having an incredible run lately. Since the US Fed continues to be hawkish on increasing the interest rate, the gold price has responded positively. We have seen the US dollar weaken as result of the Fed’s actions, which directly impacts the price of gold as shown below in the chart.
Below are 3 charts that you should find in most newsletters (although not free ones) and 1 from my Bloomberg Terminal which I find quite interesting.
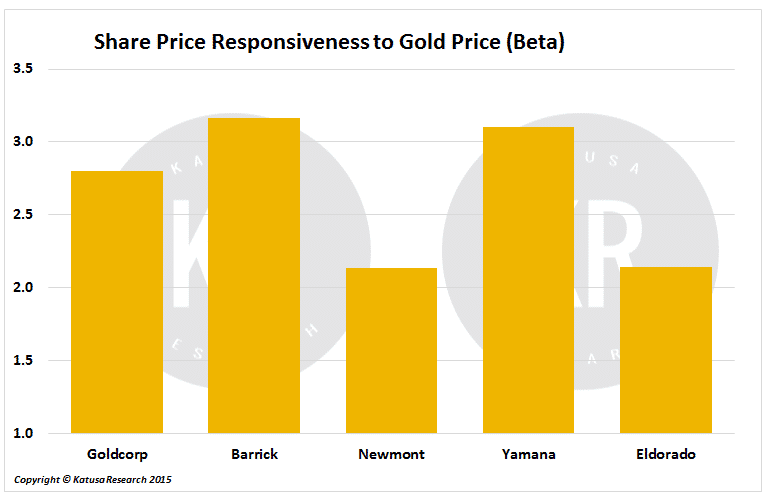
This chart below is data I pulled from my Bloomberg Terminal. This gives me the responsiveness of the company’s share price to the move in gold price. This is historical data from the last 6 months and shows that Yamana historically has shown to be the most responsive when it comes to a change in the price of gold (both up and down).
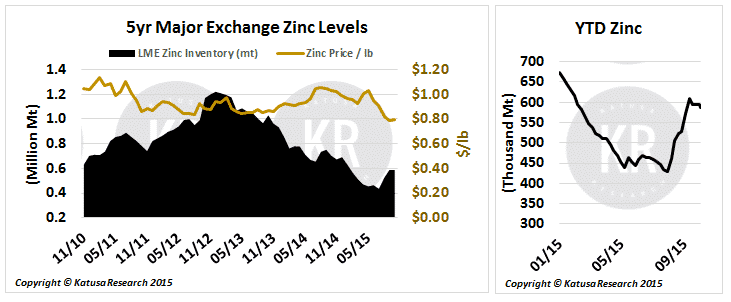
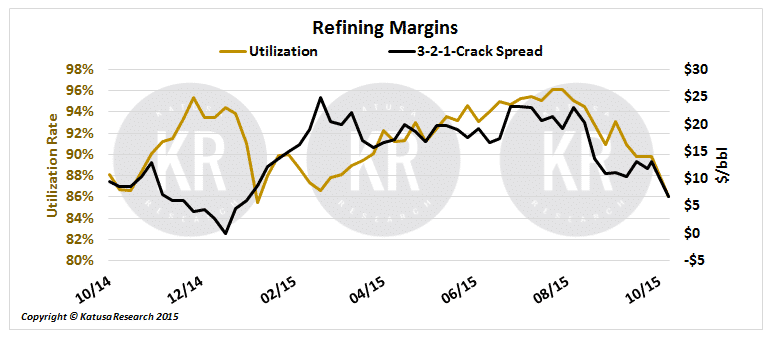
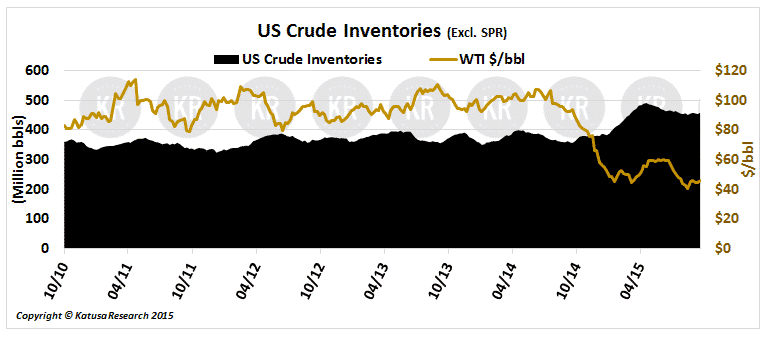
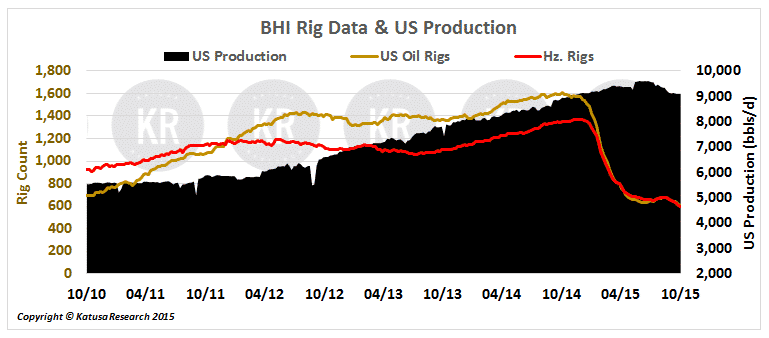
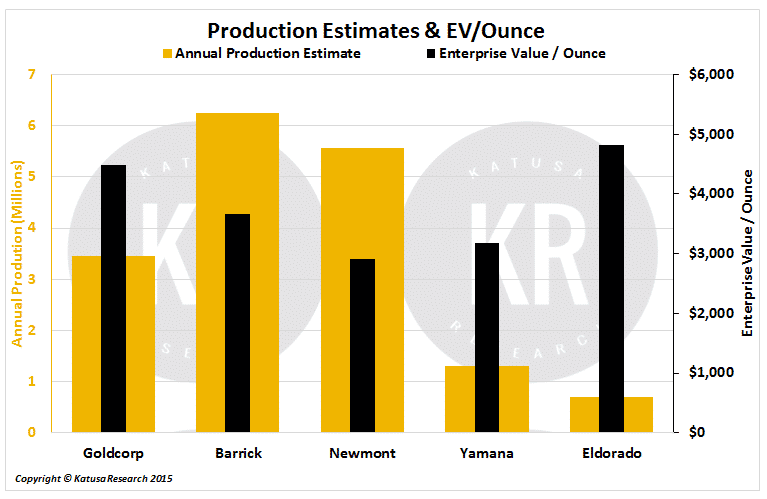
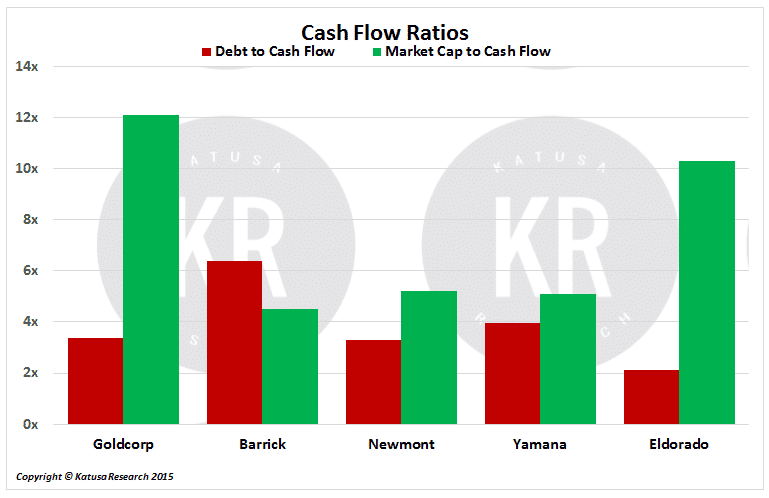
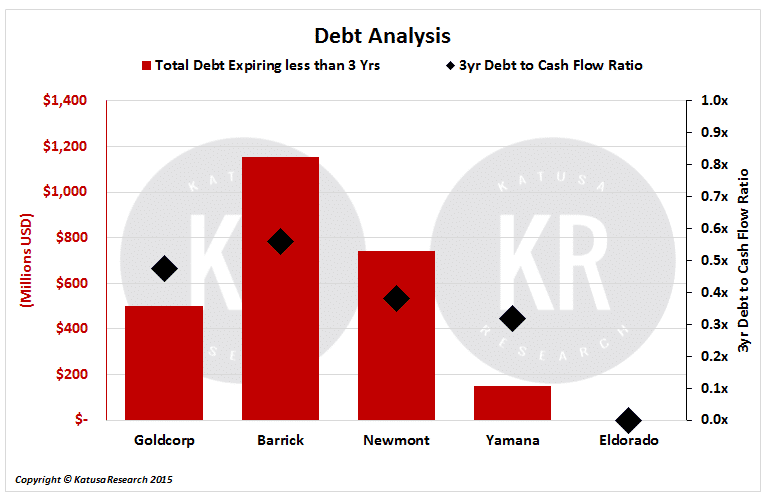
Katusa’s Charts of Interest.
Here are charts you will not find anywhere else on the net all packaged nicely in one place. Enjoy them and more importantly, pay attention to them, I do.