Let’s start with a little bit of a Time Machine.
I get that my KRO service is a premium research-based report that many here cannot afford.
Like those people, I started with nothing. I’ll never forget my roots and I’m proud of where I come from.
It’s why I have hosted many conferences for free and also mention free stock ideas here.
At Katusa Research, we look to uncover new trends and companies that are unnoticed by Wall Street. When they are, it’s time to take profits.
- Back in April 2019 in these emails, you would’ve read an article we published that GT Gold was a prime takeout candidate. For free.
At the time the stock was trading around 90 cents.
Just two days ago Newmont bid to acquire the company at $3.25.
That’s a 261% profit. Time to sell and lock in your profits.
I don’t focus on illiquid stocks.
And these aren’t tiny illiquid juniors with no revenue that trade on some dinky unheard-of exchange. These are world-class businesses run by the best management teams.
When we find these trends, we go big.
No other newsletter writer walks the talk the way I do.
I’ve been in the industry for 20 years as a professional investor and fund manager, specifically in the natural resource space. I eat my own cooking and provide my readers with the opportunity to get in at the same prices I do.
If you’re looking for a portfolio reset in 2021 to capitalize on the next decade…
I strongly encourage you to check out my premium research service, Katusa’s Resource Opportunities.
Now, back to our regular scheduled Batman report.
All Eyes on the Dollar
The $1.9 trillion-dollar Covid relief (stimulus) bill has been passed.
Last weekend, the U.S. Senate approved the Biden administration bill that includes a third stimulus check of $1,400 for American citizens.
Ironically, 3 times that amount doesn’t go to the people—but rather “government” which means most of it will be squandered.
Regardless, more benefits and money will be made available to families and small businesses.
Officially it’s called the American Rescue Plan Act of 2021.
However, who’s really getting rescued will yet be debated for years to come.
One thing’s for sure – the money won’t be going directly to those who need it most.
Current U.S. population estimates say there are 331.4 million Americans at this moment.
- With a $1.9T stimulus package, that divvies up to $5,732 per person. But you’re only getting $1,400.
The rest of that money will go towards state and local governments, businesses, new infrastructure, school re-openings, vaccines, and whatever else lawmakers can stuff into the final version of the Act.
So, what exactly does this mean for the almighty Dollar?
Let’s dive right in, because you’re witnessing history in the making.
The Mountain of Money Will Grow
Did you know that 21% of all U.S. dollars ever printed were created last year?
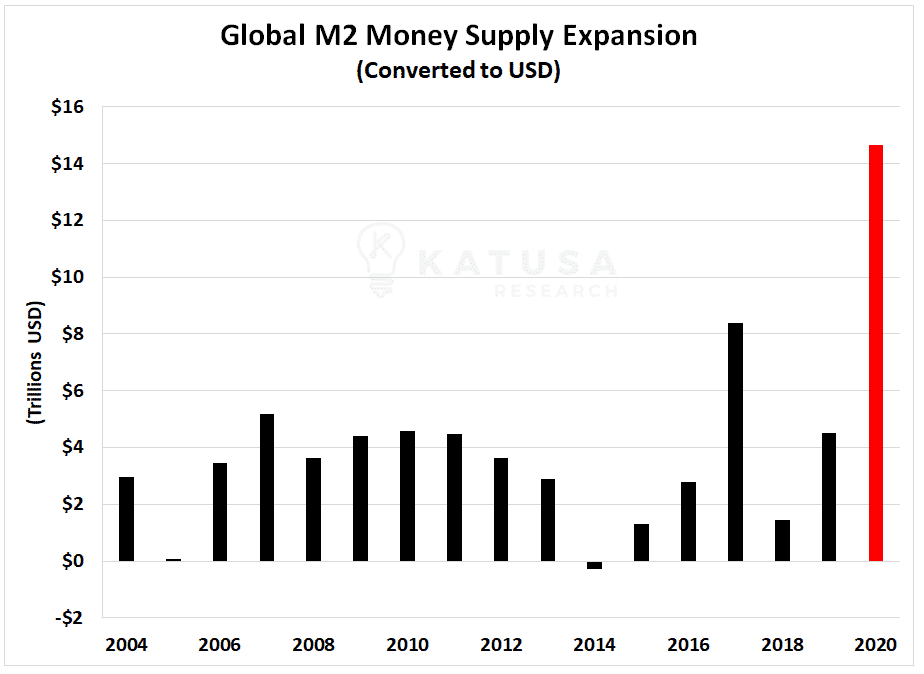
If you don’t believe me, take a look at the chart below. It shows that over $4.5 trillion dollars were printed in 2020, bringing total money in circulation to over $22 trillion.

Coronavirus reached every corner of the earth and pushed every central bank and government to the brink. With that, unprecedented stimulus around the world was required.
- In 2020, over $14.5 trillion was created globally!
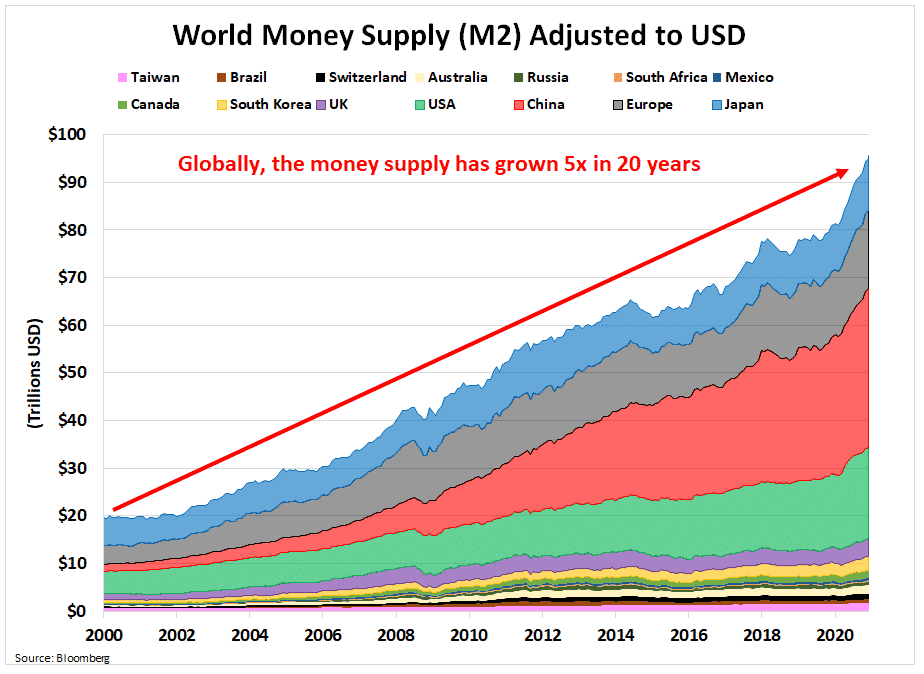
Loose monetary policy is not new. In fact, the global money supply growth over the last few decades is staggering.
- It might alarm you to know that the global M2 money supply (cash as well as easily convertible instruments) has grown 5x since the year 2000.
Chinese Money Rocket
One major source of this M2 money supply growth came from China.
Through most of the 2000s, China maintained an annual M2 growth rate in excess of 15%, even briefly reaching 30% in late 2009.
While their money supply growth cooled off somewhat in the 2010s, China still averaged over 10% growth a year through the most recent decade.
In contrast, the annual growth of the M2 money supply in the U.S. has averaged around 6-7% a year through the last few decades, peaking at 12.5%.
China’s M2 growth rate reached 25% for the first-time last year, smashing through the previous high.
Loose money leads to Financially Transmitted Diseases…
Yes, those sneaky FTDs.
Several months ago, I wrote how cheap money will fuel markets and create asset inflation bonanzas.
What we have seen in the technology sector and SPAC attack is enormous amounts of hot money driven by momentum and FOMO rather than fundamentals.
Call me old-fashioned, but I like to build my positions before the valuations skyrocket.
The Skinny on the “Stimmy”
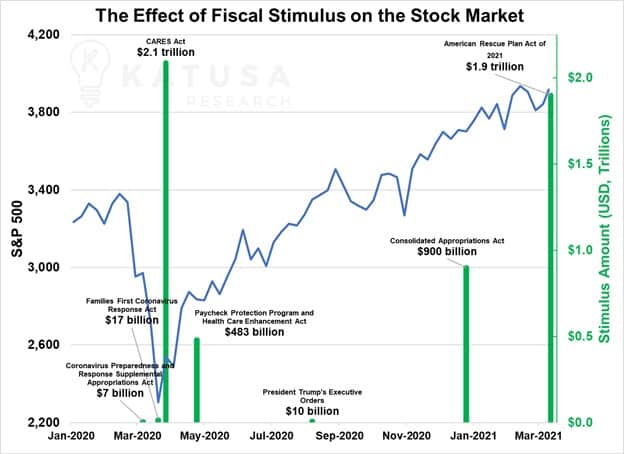
On the fiscal side of things, the $1.9 trillion in new fiscal stimulus, which already has the market salivating, isn’t helping.
The effect of the promising stimulus is that it increases investors’ risk appetite, especially in the short term.
- The more risk appetite in the markets, the better equities tend to perform against stable currencies like the USD and Yen, AND precious metals.
Generous stimulus packages are a near-certain guarantee that equities will rally… and the opportunity cost of holding Dollars instead of equities rises accordingly, leading to a sell-off in Dollars.
The chart below shows the amount of fiscal support that the U.S. government has committed to keeping the economy afloat and how the S&P 500 has responded.
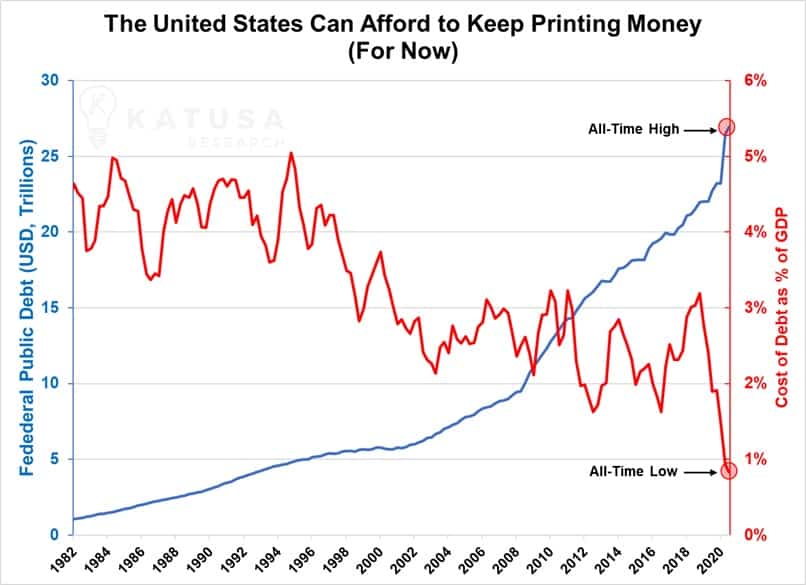
The U.S. Government will continue to spend trillions on fiscal stimulus while the cost of servicing U.S. Treasury Debt remains the cheapest in history (0.8% of GDP as of Q3-20).
Which brings us to…
The Trillion-Dollar Question:
How long is this house of cards sustainable?
U.S. bond yields have rebounded sharply due to inflation expectations and future inflation uncertainty.
Higher bond yields indicate that newly issued debt becomes more expensive.
However, in real terms (meaning adjusted for inflation), the cost of debt is still negative. This means that it’s realistic we see the U.S. Government 10-year and associated nominal bond yields continue to climb.
Historically, GDP growth rates and U.S. government bond yields were a reasonable proxy for each other.
Going back as far as the 1960s, the spread between GDP growth and U.S. 10-year bonds has averaged less than half a percent.
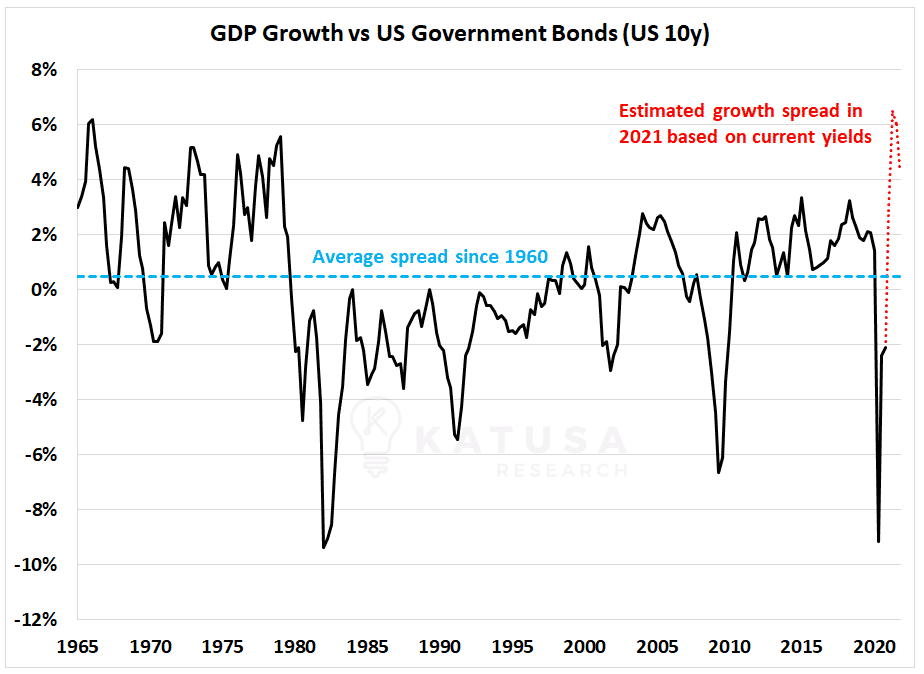
The average estimate for U.S. GDP growth adjusted for inflation is over 5% for the year. So by this historic measure, bond yields should be much higher than they are today.
It’s not out of the question that we see the U.S. Federal Reserve resort to a form of Yield Curve Control (YCC), a key topic I discussed as the world began to recover from the coronavirus.
YCC will allow the Fed to keep long-term interest rates from rising too quickly.
At the same time, it allows for low-interest rates in the short term to prop up the economy.
It’s the most delicate house of cards one could imagine.
What Does that Mean for Your Portfolio?
It means you should have exposure to tactical growth opportunities along with exposure to gold.
For example, opportunities that capitalize on the flood of money pouring into sustainability.
- Did you know that renewable energy is now the cheapest and most cost-efficient form of electricity generation?
- Or that growth within the sector is poised to skyrocket?
Fortune favors the bold but smiles upon the prepared.
Regards,
Marin


