Regular Katusa Research readers know that one of the biggest, most important, most lucrative trends of the next 20 years will be the rise of green energy… and the concurrent decline in fossil fuel consumption.
Thanks to radical improvements in technology, solar energy and wind energy are now cheaper than energy from fossil fuels in many areas. Also, pollution and climate change are huge worries around the world.
To go along with voters’ desires and fight what they see as man-made climate change, governments will spend trillions (with a “t”) of dollars on solar and wind energy. They will pass laws to encourage green energy production and consumption. They plan to revolutionize the way we power our electrical and transportation systems.
Huge winners and huge losers will be created. It’s going to be one of strongest financial tailwinds we’ll see in our lifetime. Making money from this trend will be like selling web services during the ’90s Internet gold rush… or selling bullets during World War II.
Like any big trend, there are many ways to position yourself to benefit from it. For example, my readers and I own one of the world’s premier small cap green power operators. And over the coming months, I plan to accumulate stakes in some of the world’s best copper deposits.
That’s right. Copper has become a great way to invest in the green energy super-trend. I believe it can make us a great deal of money over the next five years.
To fully understand the upside potential copper mining stocks have right now, we need to quickly cover where the copper market has been, and how the right copper investments can create great wealth quickly.
Making Huge Returns in Copper 101
Copper is a vital building ingredient in nearly everything around you. It’s used for wiring and plumbing in houses. It’s used in cars, infrastructure projects, and appliances. It’s a major component of power lines and electric motors. And as the 2009 – 2011 period shows us, this vital building material is capable of staging incredible rallies.
Like all natural resources, copper goes through huge booms and busts. That’s why we say resources are “cyclical.” If you get in early before the booms and avoid the busts, you can make a lot of money in natural resources.
As you can see from the chart below, copper experienced a huge bust during the 2008 financial crisis. Investors were terrified the next depression was around the corner… which would mean a lot less copper consumption.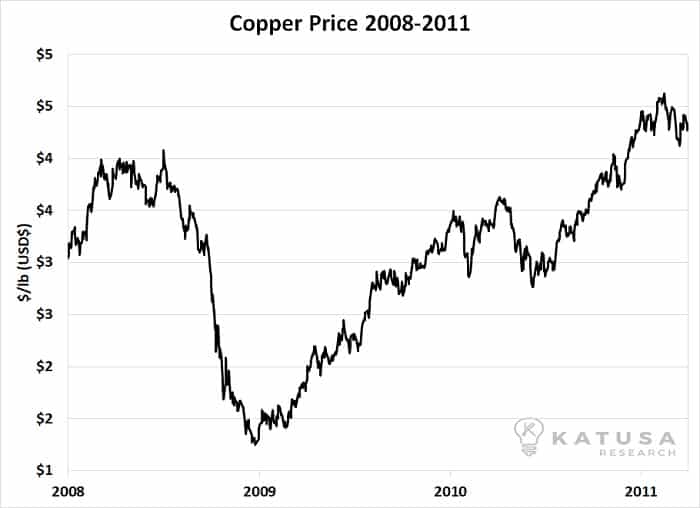
Over the past four years however, it’s been downhill for copper investors. Global economic growth has been sluggish…and copper plummeted from $4.50 per pound to $2 per pound, a decline of more than 50%. You can see this bear market in the long-term chart below: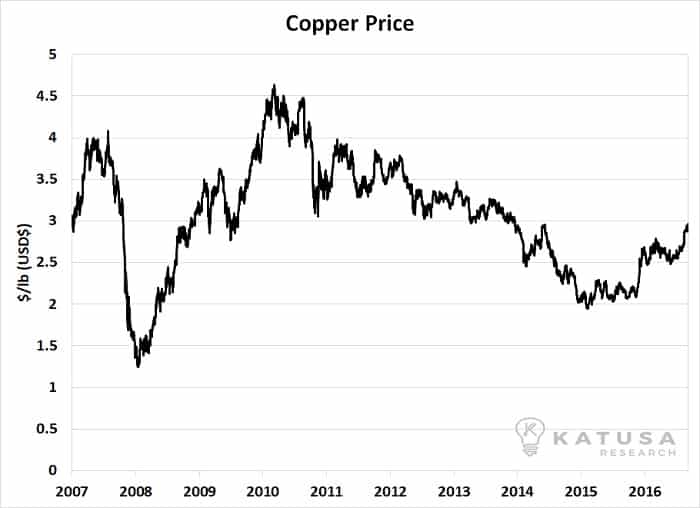
Why Copper Demand Stands to Increase… a Lot
Let’s start with the obvious demand growth catalyst: Electric Vehicles (EVs). I believe this sector will enjoy tremendous growth over the next 20 years. EVs are a major part of reducing carbon emissions around the world.
Electric vehicles require three times more copper than conventional vehicles with international combustion engines. On average, an internal combustion engine uses 55 pounds of copper. A hybrid uses about 110 pounds and an EV uses 165 pounds of copper.
Over the last five years, EV sales have grown at a compounded growth rate of 32% annually. You can see this uptrend in the chart below.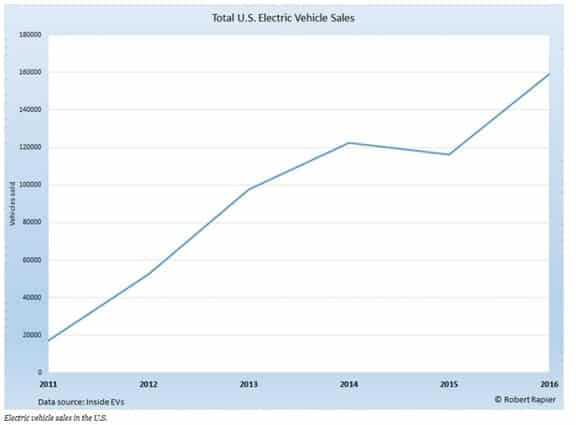 In 2016, 159,139 EVs were sold in the U.S. EVs made up 1.6% of the market.
It is expected that by 2021, EVs will make up 4% of the total vehicle sales in the U.S. The consensus from independent analysts, including the brain trust at Bloomberg, is that by 2030 the adoption of EVs in the U.S. will be 34%.
What does that mean for copper demand?
First, we have to make some assumptions to calculate the net effect on the copper demand. Let’s assume a conservative adoption rate by 2030 is 20%, not the accepted 34%. By using an adoption rate of 20%, that would mean by 2030, there would be 3.6 million EVs sold in the U.S in 2030.
But let’s assume EV technology becomes much more efficient and the amount of copper needed per car decreases to 100 pounds by 2030. Conservatively the U.S. automobile sector in 2030 alone will consume 1.1 billion pounds of copper, of which the EV sector will consume 360 million pounds or 33%.
That is a lot of copper. Just the new EVs, using my conservative metric, will increase U.S. annual copper consumption by just under 9%.
Now let’s look at China.
China is the world’s largest vehicle market. In 2016, 282,000 EVs were sold in China, which was 77% more than what was sold in the U.S. This is where the numbers become mind-boggling. In 2016, 28 million vehicles were sold in China. The EV market in China is 1% of total sales.
The Chinese government is planning for 4% EV adoption by 2021, which would mean 1.12 million EVs will be sold in China in less than five years. Again, using our conservative estimate of 100 pounds of copper per EV, in 2021 China’s EV market will consume 112 million pounds of copper on top of the 1.35 billion the rest of the Chinese vehicle market will consume.
The Chinese government plans on mandating specific quotas of EVs its makers must follow. The government plans on making the automakers responsible to meet the quotas, not the public. Also, China also has similar subsidies as the U.S. for the adoption of EVs.
China has stated it wants 7 million EVs (or 20% of the 35 million vehicle market) by 2025. That means the total consumption of copper in the Chinese vehicle market will be 2.1 billion pounds, of which 700 million pounds will be just EVs.
I think you get the picture with just the U.S. and China. The rest of the world will follow.
The chart below published by Bloomberg New Energy Finance shows that by 2040, the global EV market could get to over 60 million vehicles sold that year alone.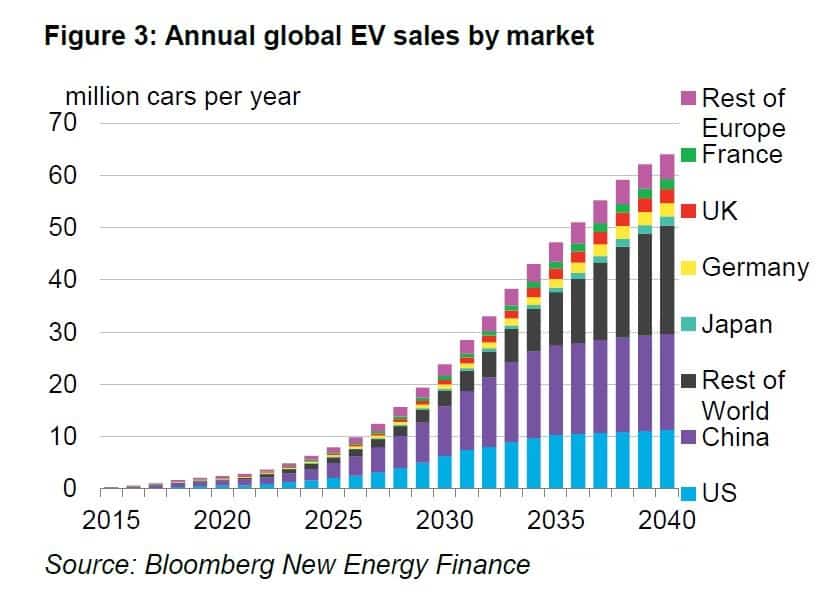
The fact is, scientifically speaking, for the EVs to become even more efficient, they would use more copper per vehicle, not less. That’s an interesting topic for another day, but it comes down to efficiency. Aluminum cannot replace copper in EVs for many reasons.
Infrastructure projects
What I didn’t mention yet is the amount of “plug in” infrastructure that will be required to meet EV demand. All those EVs need special charging stations. China is heavily investing in new electricity grids and the U.S. under President Trump plans major infrastructure projects that will all create new demand for copper.
All of this means that in just 10 years, the growth for copper demand will compound at 4-5% annually. That’s a lot of growth for an already mature market.
I think this type of increase in demand will provide a conservative baseline for copper to reach $5 per pound by 2020.
Sure, recycling of copper will meet some of the demand, but at $4.50 per pound, recycling met less than 20% of the demand. Recycling copper is a high cost solution. Also, there are new restrictions on recycling copper in China that will also increase the cost of recycling.
Another major new source of demand for copper will be the Smart Home. Smart homes use over twice as much copper than a traditional home. Installing the solar roofs, and all the other features that include the electrification of a smart home will double the use of copper in a house.
Historical global production copper demand growth is 3.34% annually.
The reality is, higher copper prices will be required to bring on new production. Historically, global production has increased at 3.42% annually. That includes the hundreds of billions of dollars that went into the sector during the greatest bull market in copper history, driven by the modernization of China, in the 2000s.
That said, I have conservatively analyzed copper demand growth using 3.75% growth and I’ve increased the supply to 3.5% annual growth. The chart below uses actual historical production and consumption numbers annually and projected out using the above metrics mentioned above to 2040.
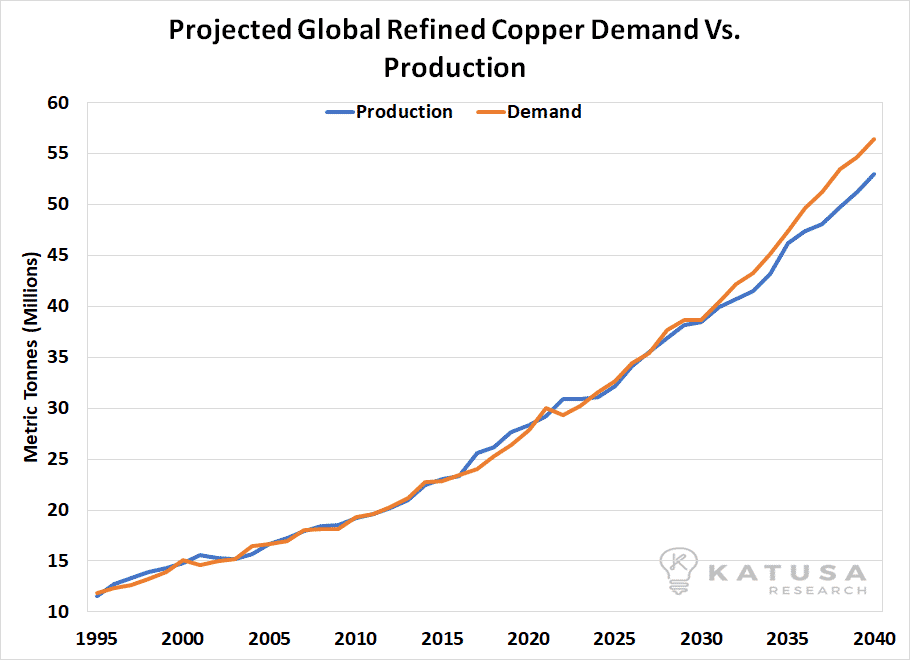
The above chart is the conservative scenario which clearly states there will be a bull market in copper. And I believe the above scenario will take copper to $5 per pound by 2020.
But it’s the next scenario that could make copper the hottest commodity over the next decade.
It is expected that new EV demand globally will increase copper demand over the next 25 years by 1.25% annually. Combine that the existing 3.34% historical average, and there could be a scenario that the growth rate of copper reaches over 4.5% annually over the next 25 years.
The chart below shows the historical supply vs demand chart of copper historically and for the growth of copper globally we used 4.5% annually. We have projected the growth rates of demand and supply to 2040. If this happens, copper will be treated as a precious metal as there just is not enough copper economically available under $5/lb to meet the global demand.
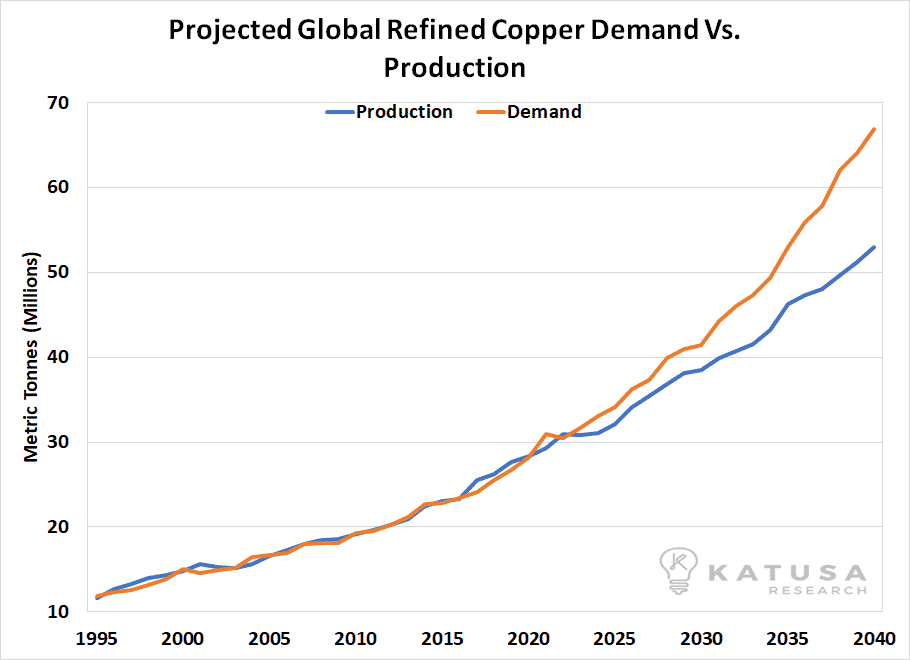
As a result, copper will have an incredible bull market.
The major takeaway is that the tight copper market is going to become very tight over the next 60 months and then copper demand growth will significantly outpace the available production. I believe this will result in an incredible bull market for copper.
The Copper Bear Market is Over
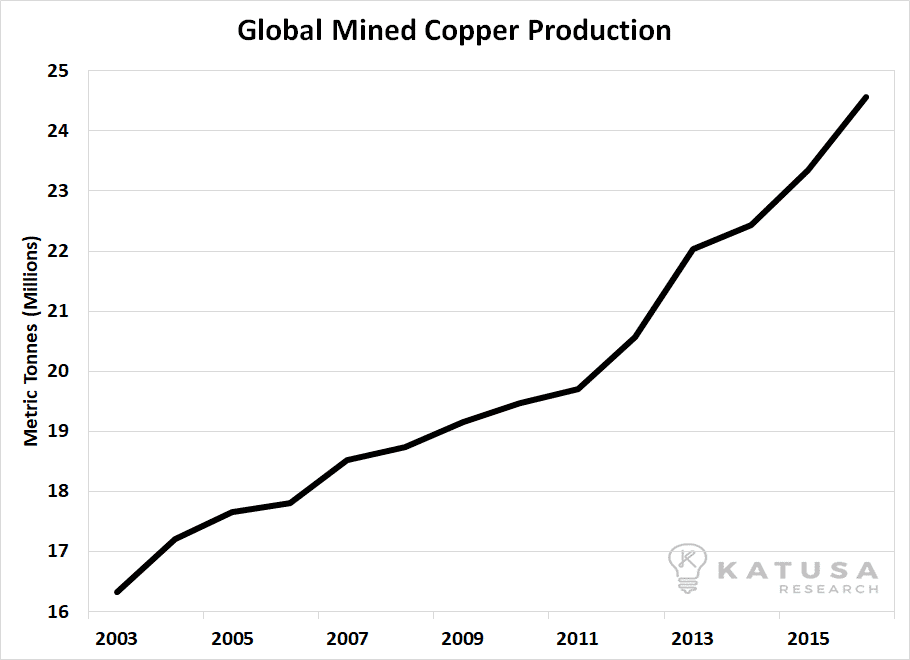
Given big decline in prices from 2010 to 2015, you might think copper producers would have curtailed production. That’s not the case.
As you can see in this chart of global copper production, miners have increased production. But those same producers will soon hit a wall, as I will explain shortly.
The producers did whatever they could to keep their operations alive, including “high grading” their mines. High grading occurs when a miner extracts the highest-grade ore in a mine in response to low prices. It’s a near term solution, that has a negative long-term effect on the ore body.
Nothing is worse in mining than high grading your deposit during a period of low commodity prices. This is because when the market turns around and prices are higher, you are left with a high strip ratio and low-grade ore. Basically, you’re left with the warm beer at the bottom of the bottle.
This means that mines who have high graded their productions will get smacked in the face with higher costs of copper production.
But the situation is getting even more bullish for copper…
The price of copper is set to break $3 per pound, but can the infrastructure in place handle any new production?
I believe it will struggle and fail to accommodate meaningful production increases. Let me explain.
Operating a big open pit copper mine requires enormous amounts of electricity. It powers electric shovels and trucks. It powers the mills that crush the rock. It powers lights. Depending on the operation, electricity can be anywhere from 15-30% of the cost per pound of copper produced.
During the downturn of the last few years, electrical grids in many parts of the world that have advanced promising copper deposits (that should be soon in production) have not increased electrical capacity that can meet the demand from the copper mines. A general rule of thumb is for 100 million pounds of open pit copper, a mine needs 65 MW of electrical capacity (an enormous amount of electricity). This capacity requirement is equivalent to 65,000 homes needing electricity.
As the project gets bigger, the ratio improves by 15% for every 100 Million pounds.
Many of the expected copper projects that the market expects will come online shortly in Africa cannot tap into in the existing electricity grid because there is simply no excess electrical capacity.
As a result, the potential copper mine will have to make up for the lack of electricity from the grid with their own, higher-cost sources of electricity, whether it’s by installing diesel generators or by building their own power plants. In other words, the price of copper under $4 per pound doesn’t justify the infrastructure capex.
Also, expect certain countries in the third world to use access to the existing electrical grid as another piece of leverage for a piece of the profits at higher copper prices.
For example, large copper producer First Quantum Metals was just told by the Zambian government that the amount of electricity that will be supplied to their copper operations will be reduced.
The Zambian government is using electricity as leverage for a bigger piece of the project’s profits. But at the end of the day, this will result in a higher cost of production because now the company will either have to pay higher prices for electricity or install supplemental power sources at a much higher cost.
This is just another form of nationalization that I have written about over the years. The point is, copper producers are facing rising costs. Coupled with rising demand, it ensures that copper has found its low point.
The Expert’s Way to Buy Copper Assets
Last year I stated we would wait 12 months for the market supply and demand to find a base, and that is exactly what has happened. Prices have finally moved significantly off their 2015 bottom. The big trend has changed from bearish to bullish.
Now is the time to start buying world-class, big, top tier copper assets in politically-stable jurisdictions.
The best part of the above statement is that there aren’t many projects that fit the above description. And because of that, they will fetch a premium during the coming copper asset consolidation.
Over the next 24 months, I believe we will see some significant consolidation in the copper development and production sector.
But before you invest, you need to know about the biggest secrets in the copper sector that nobody wants to talk about.
Your Edge in the Market: What Most People Don’t Know About Copper Projects
There are some big secrets when it comes to what majors look for in world-class projects.
Let’s start with something called “clean concentrate.”
Copper concentrate is what a miner sends to a smelter after the rock that hosts the copper is crushed, grinded and the copper is extracted and concentrated. The smelter turns that copper concentrate (usually concentrate is anywhere between 22.5-30% copper) into the copper we use in buildings and manufacturing.
When a copper producer sends its concentrate to a smelter, it can contain nasty stuff like mercury, arsenic, and antimony. That’s what we call dirty concentrate. When copper concentrate has high levels of “nasties,” it is “dirty” concentrate.
Not only does a producer get “penalized” for dirty concentrate (meaning it gets less per pound of copper than “clean concentrate”), some smelters flat out refuse dirty concentrates when there is an excess supply of it.
The global smelters are in high demand for “clean concentrate”
You probably didn’t know this… but for years smelters have been dealing with this secret by “blending” the dirty concentrate with clean concentrate.
Ironically, mines in Chile (the world’s largest copper producing country) such as the giant Escondida mine are showing higher nasties compared to when they first started many years ago. Many of the large copper producing mines will go through the same thing.
The Asian smelters who are now dealing with a lot of supply of dirty concentrate can dictate smelting fees, which means the dirty concentrate producers are getting slaughtered. This means that BHP, Rio Tinto, MMG and Freeport all are dealing with this very dirty secret.
Nobody is talking about this, but they will be soon.
This is a small nuance that can have huge effects on a copper investment. A company can have a lot of copper in the ground, but dirty concentrate production can kill it, and your investment.
Another major factor is the logistics to the smelter. Where will the copper company send their copper concentrate too? Access to a port is just one of the many concerning issues to check off the list. Another major factor is the question of whether the smelter that the company believes is the logical choice even want that copper concentrate.
To sum up, I am very bullish on top tier, world class copper deposits that have the following: Lowest-cost production, produce clean concentrate and are located in safe jurisdictions right now.
These assets will be the first to be bought out over the next 24 months in the copper sector.
In the upcoming issue of my premium research service, Katusa’s Resource Opportunities, I will explain in detail the copper assets any serious resource investor should consider buying for their portfolio.
Regards,
Marin Katusa
P.S. I expect to make at least 300% in the coming copper rally. To get my top recommendations, along with all my other research, consider becoming a member of Katusa’s Resource Opportunities right here.
