The volume of emails and questions I get asking to buy XYZ gold or silver stock is at the highest level in a long time.
And it’s coming from seasoned and new investors and subscribers alike.
Be patient and always remember the quote from Charlie Munger:
“It takes character to sit with all that cash and do nothing.
I didn’t get to where I am by going after mediocre opportunities.”
Readers have been writing into the inbox in large volumes, asking for gold and silver exposure.
But the prudent and responsible thing to do is to wait for a pullback, which always comes.
How sharp or long the pullback will be – no one knows. But it will happen, and you want to be prepared.
Like Charlie Munger, I didn’t get to where I am by chasing opportunities with the herd.
Opportunities being touted by self-acclaimed “gurus” that have never actually been part of real success. Nor part of any experience on the successful discovery of a deposit. Nor the development of a mine on the corporate side. These are major warning signs to stay away from popsicle stand gurus.
Above all, I want to remind readers not to chase stocks.
We’ve just seen the 8th largest dollar wise pullback in gold history. We’ve stated this would happen.
But on a percentage wise pullback, it’s not even top 10. Pullbacks are normal in all bull markets.
The Price of Gold vs Gold Stocks
The next chart is something that we’ve published in the past. It highlighted short-term resistance at $1,750. If gold broke above that resistance, the extension target was $1,850 to $1,925.
Gold blew straight through the extension target and is now knocking on the door of $2,000.
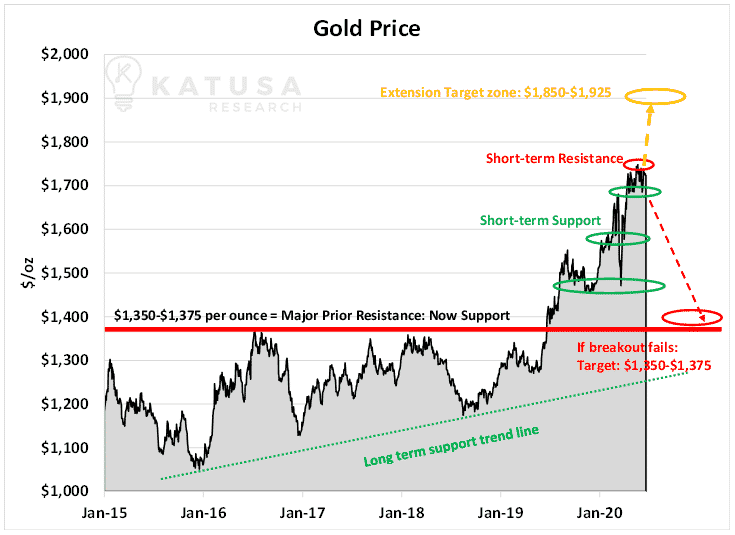
It is very natural for the price of gold to consolidate and test the previous consolidation level.
So far, gold could not hold above $2,000 for a week. Gold dropped $150/oz and now is flirting with testing the $1,800 handle.
But even a correction to $1,800 would not be considered unhealthy or unwarranted. It may not be what you want or what makes you feel good, but your desires are irrelevant.
The sooner you can control your own emotions, the better you will become in both speculation and investing.
One of the big questions every investor and speculator in precious metals is asking is this:
Why are gold stocks are not performing as well as the metal itself?
Is that comment even true?
- Given the leverage the mining prices have to rising gold prices—one could believe that gold stocks “should” be higher.
There are a few reasons gold equities have not responded according to expectations for $2,000 gold.
First off, $2,000 gold didn’t last even a month, so nobody was using $2000 in their models.
Secondly, institutional investment in the gold sector drives large share purchases that bring prices up or down.
The “paper gold” market, which consists of ETFs backed by gold, has seen billions of dollars of inflow. But the miners have not seen the same capital inflows.
That means…
- Money is going for direct exposure to gold—not exposure via gold mining company shares.
Now let’s look into some detail on what’s going on.
Institutional Money and Gold
To find out where big institutional money is going, we start with the physical gold ETF’s. These are the most liquid way for generalist funds to buy and sell for exposure to the gold sector.
The next chart shows the institutional fund flow for all the physical gold ETFs, including GLD, IAU, and GLDM. You’ll see that there has been significant buying activity every week since mid-March 2020.
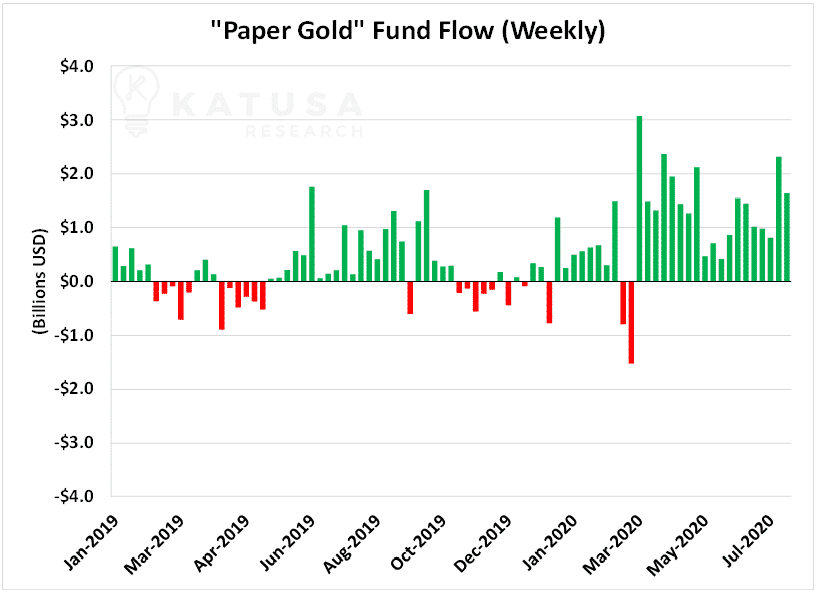
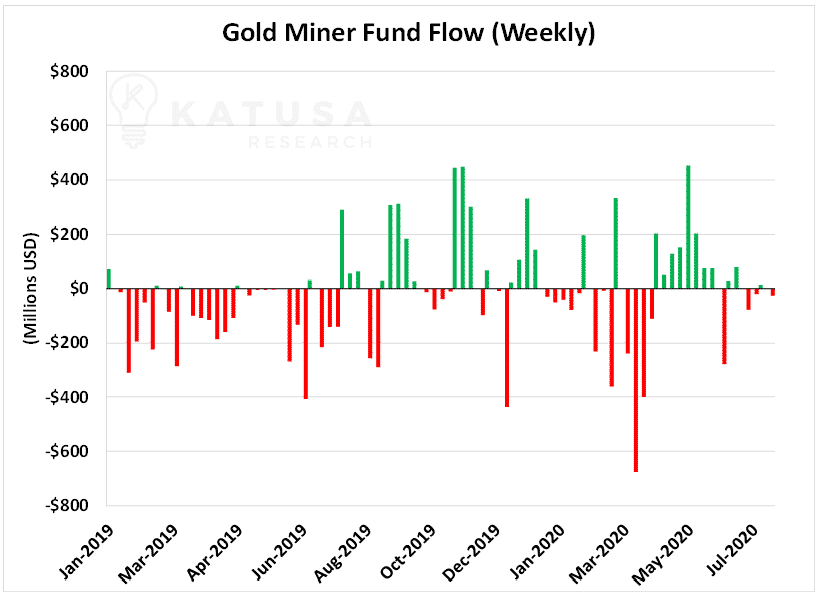
Note that the dollar volume units are one-tenth of those in the previous chart.
- What you’ll see right away is that money going into gold miner ETFs is a fraction of the money going into gold ETFs.
And the buying is all over the map. May 2020 saw the only solid streak of consecutive buying.
The next chart below shows the cumulative fund flow for the paper gold market versus the gold miner stock sector, starting in January 2019.
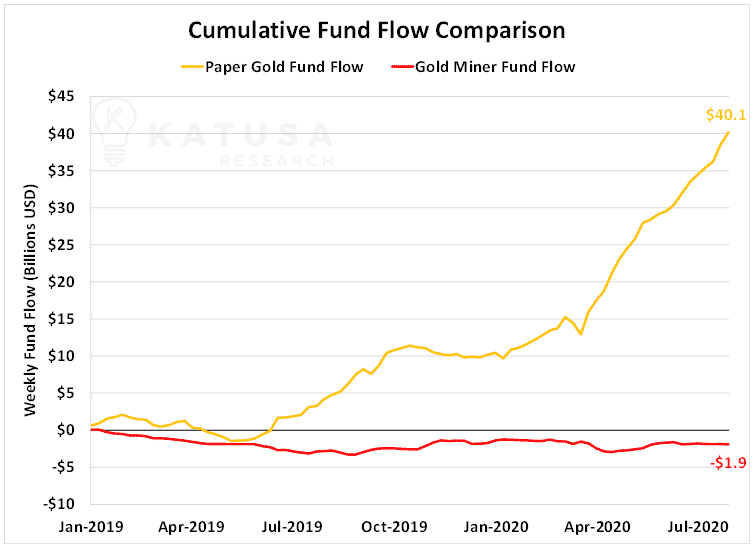
- Since January 2019, the ETFs that provide exposure to gold miners have seen a net decrease in flow of funds.
Meanwhile, ETFs that hold direct exposure to gold have added $40B.
So How do the Gold and Silver Stocks Break Out of Their Slump?
Gold mining stocks have been hated by the generalist funds for a decade because so much wealth destruction occurred in the last cycle.
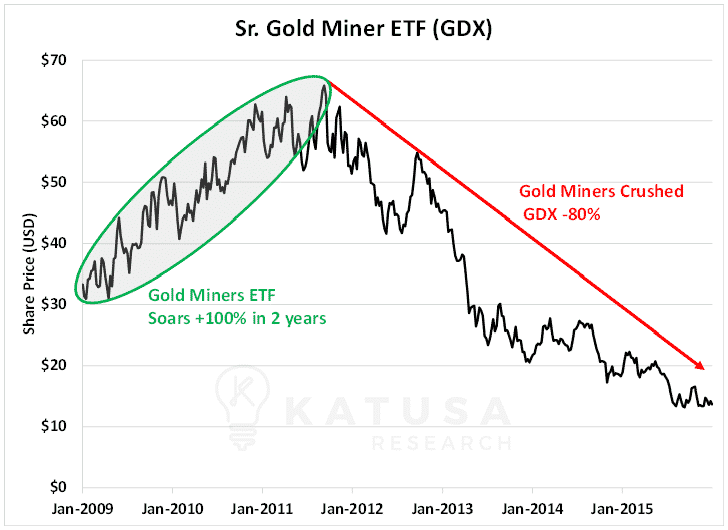
As shown below, two good years in gold stocks led to 5 years of cratering share prices.
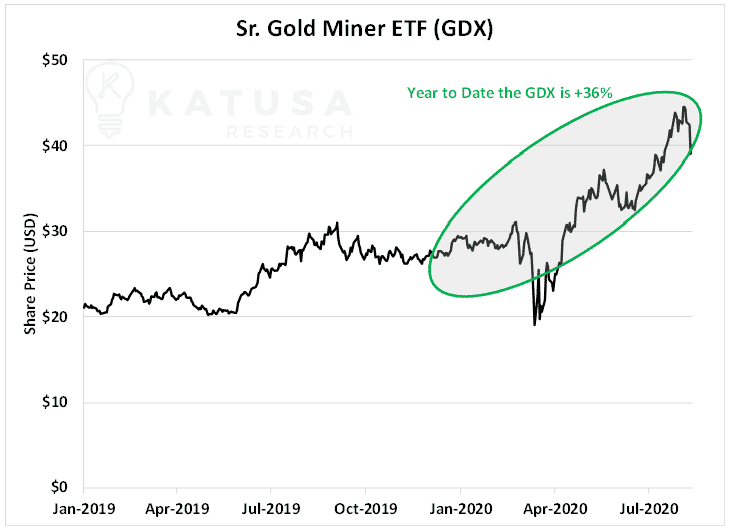
From June to today (in the yellow box below), the share price is up 20%—and fund flow is negative.
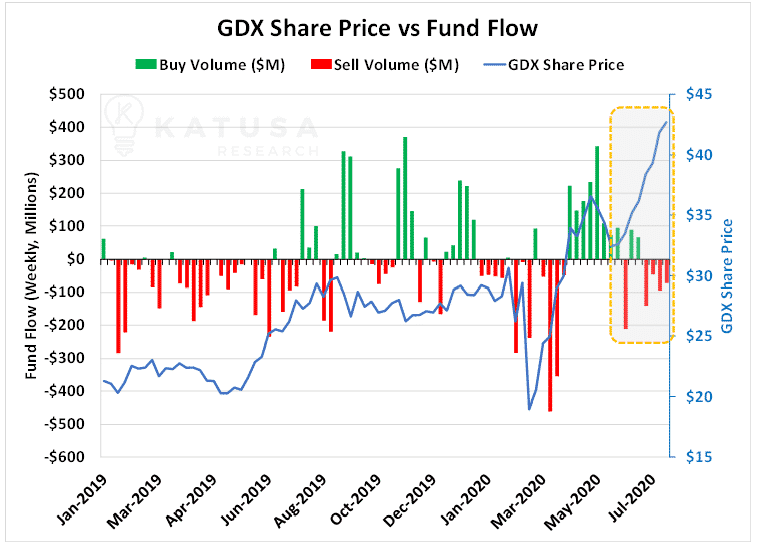
- You can see that the month of July as gold broke $2000, the red bars show flows of funds negative indicating profit taking.
Since June the fund flow is negative, but the share price is up 20%.
We will see further consolidation and profit taking. However, if gold breaks $1,750, we will see further exodus of funds.
If we see gold consolidate its breakout above its old record high, that should fuel new entrants into the space.
If that happens and gold does not break the previous support levels, it will be on its next leg—and going much higher.
Playing the Long Game
I am very bullish the price of gold over the next few years, but in the near term we may see further consolidation. Gold might test the previous consolidation range of USD$1,650–1,750.
If gold breaks down, it will be an incredible buying opportunity.
We will send out an alert on what we will be doing with our own money to subscribers of Katusa’s Resource Opportunities.
The last time we saw a major correction, I published a series of alerts with 5 companies on my buy list.
The coming weeks and months saw multiple triple digit returns.
- You have to be mentally prepared (to take action) and physically prepared (with cash ready) for the opportunity.
Being all in and not taking profits off the table and Katusa Free Rides will leave you empty when it’s time to hit the Home Run Pitch.
- You must make your wins large and meaningful…and your losses small and insignificant.
Folks like Babe Ruth have used the “home run” mindset to achieve success for centuries.
Professional gamblers have used it to clean out casinos. Top traders have used it to generate 100%+ annual returns. And the venture capitalists I mentioned earlier have used it to make billions in startups.
Top performers fail as often as anyone.
But top performers ensure their failures are small and limited…while their successes are large and meaningful.
In fact…
- One of the companies in our portfolio of resource stocks jumped as much as 49% in a single day on the back of one of the most incredible drill holes of the year.
Right now, I am working on two huge deals, that I along with my subscribers will be participating in at the same price as management.
If you want to follow along and seize the best pitches as they cross home plate, become a member of Katusa’s Resource Opportunities.
We’re still in the early innings of something truly special.
Regards,
Marin Katusa
