It’s an alarming and uncomfortable feeling for many gold investors.
As stocks continue to soar, gold notched its worst month in 4 years falling 6% in February.
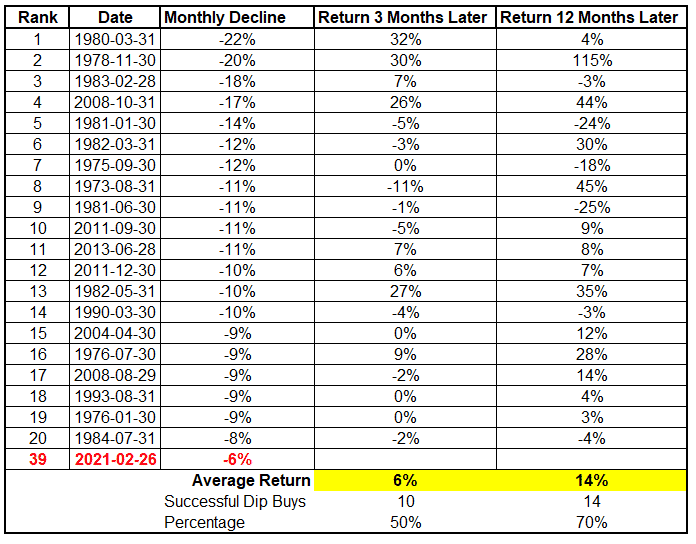
While a 6% down month may not feel great to your portfolio, it’s nowhere even close to some of the worst months gold has faced.
You’ll see in the table below that February’s 6% drop ranks 39th in gold’s all time worst months performance.
Gold, Buy the Dip?
History doesn’t always repeat itself, but the numbers speak for themselves…
Major declines commonly lead to higher prices 12 months out.
- You can see that out of the top 20 declines, 70% of the time, a year later, prices are higher.
You can also see that there is no need to rush out and load up the first day after a big decline.
It’s only a coin flip as to whether you will be ahead or not, and the average return is only 6%.
Why are Gold Coin Premiums Still so High?
If you’ve called your local bullion dealer to get your hands on some physical precious metals and got frustrated, you’re not alone…
While the paper market has taken a dive, demand for physical remains very strong or at least that’s what the dealers will lead you to believe. It seems like every bullion site is “a minimum of 3 weeks to delivery”.
- The premium paid for physical gold bullion over spot is at the highest it’s ever been, save for one bizarre day in 2014 in nominal dollar terms.
Surely that’s bullish for the future?
Below is a chart which shows historical gold coin premiums as quoted by many coin dealers.
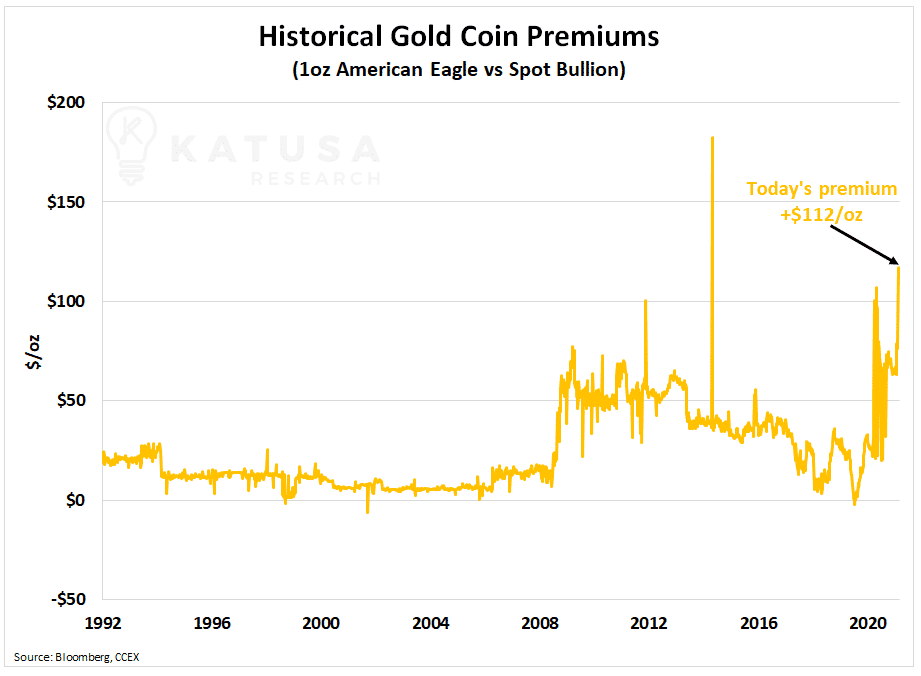
Sharp eyes will see a problem with this graph. It’s in nominal U.S. Dollars.
A $117 per ounce premium is a bigger deal when gold is $500 per ounce, rather than at $1700 per ounce like today. Focus on the premium %, not the total dollar amount.
Next, you’ll see a chart which shows the coin premium in percentage terms. This normalizes the data and allows for an apples-to-apples comparison.
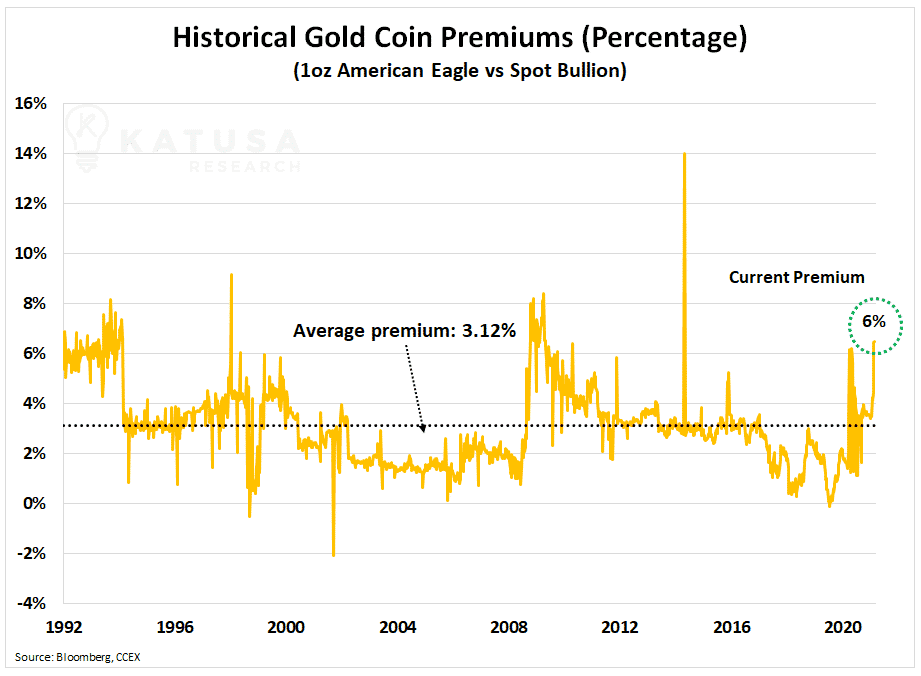
As you can see…
- On a relative basis, coin premiums are close to double what they normally are.
But we aren’t in “record” territory like many would lead you to believe.
Since 1992, the average coin premium has been approximately 3.12% above the spot price. That’s still too high in my opinion, as you should be able to grind your dealer for 1.5%-2% premiums.
Over the past 3 months, coin premiums have jumped from just over 3% to over 6%.
Are Coin Premiums a Leading Indicator for Gold Prices?
The only way to answer this question is through careful gold price analysis.
Below is a table which shows the 12-month holding period return after the top 20 largest spikes in gold premiums.
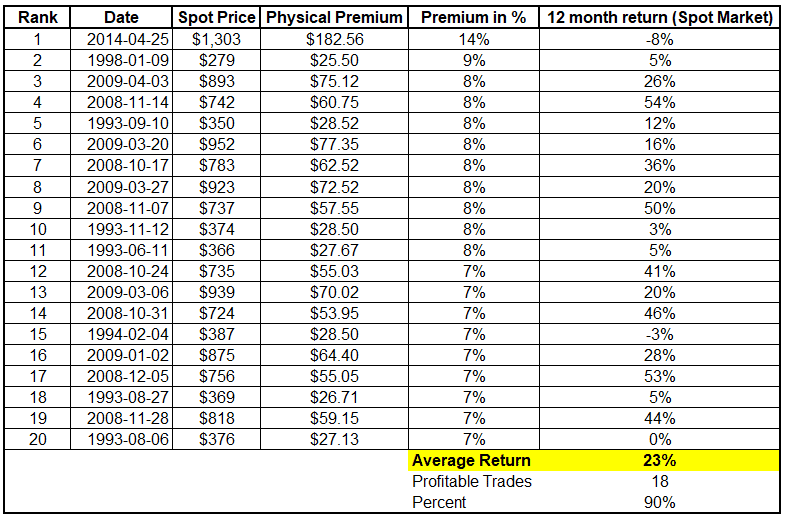
Amazingly, if you just used this as an indicator it would produce incredible returns.
If you bought gold when premiums were highest, you would be up money 90% of the time a year later, using that data set. But always remember, data set depends on the data in and the dates of that data.
The results sounded too good to be true…
So in true Katusa data math alligator fashion we dug a lot deeper.
Now, recall I mentioned the average percentage coin premium is a little over 3%…
Statistical analysis shows that the standard deviation of gold coin premiums is 1.59%, hence my comment that you should be able to get coins between 1.5%-2% premium range.
This means that a high percentage of the time, coin premiums would fall between 1.5% and 4.7% of the gold spot price.
But we want to know what happened in extreme circumstances like today, where premiums are very high…
So, we went with a nice round 5% premium and ran the numbers.
The output is in the table below. It shows the historical returns from buying gold when coin premiums are higher than 5% and holding the position for 1 year.
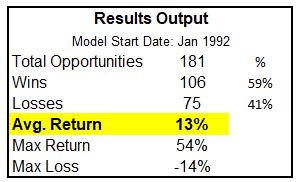
When looking at all the data, a large coin premium can lead to profitable returns, but they are not an overwhelming indicator of upside potential.
- The key takeaway: Don’t let the dealers fleece you into thinking coin premiums will drive momentum in prices.
Now let’s turn to everyone’s favorite precious metal of the moment (or maybe with the most vocal cheerleaders!)…
How High are Silver Coin Premiums?
On the heels of the Reddit army, silver has outperformed gold.
For the year to date, the currency of gentlemen (as I like to call it), is unchanged while gold is off 9%.
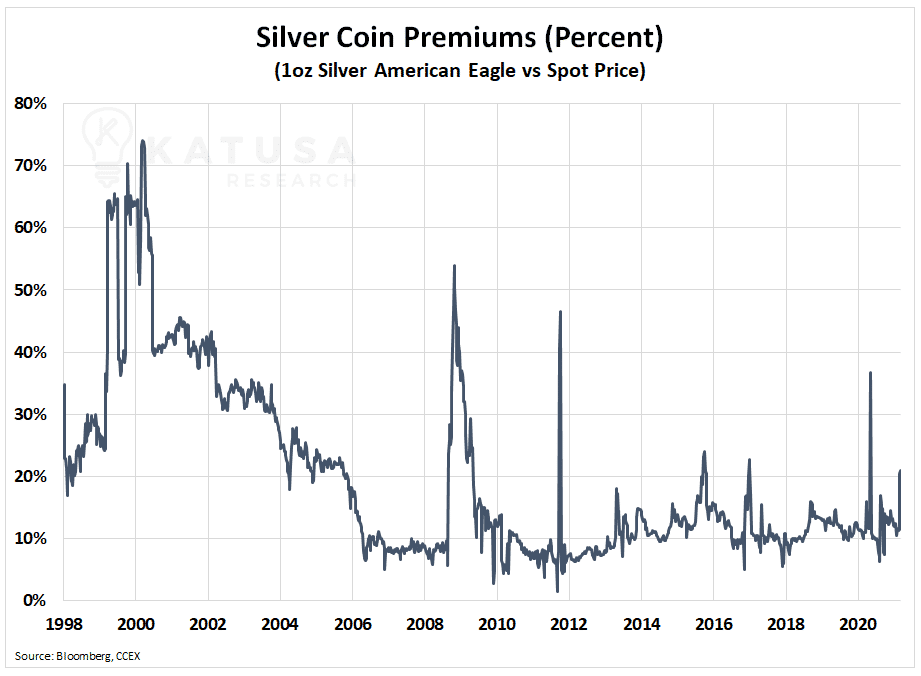
Physical coin premiums have shot up in recent days, trending well above the average 5-year premium.
Below is a chart showing the historical premium for silver coins.
What’s Moving the Gold Price?
What is truly moving the gold price right now is the move in U.S. real interest rates.
- Real interest rates are interest rates which are adjusted for inflation and this indicator correlates incredibly well to gold.
Right now, many investors are getting concerned that all this money printing is going to lead to inflation which in turn leads interest rate hikes.
But I have a different take on the situation…
I outlined the situation in detail to my subscribers in my latest monthly issue which was just released…
Along with a full fundamental and technical analysis walkthrough. Then I detailed what my top gold stocks to buy are and what prices I’m willing to put my money to work at.
At Katusa Research we focus on where the puck is going to be, not where it was or is today.
If you are tired of investing with the herd and want a refreshing new perspective from a guy with 20+ years of experience as a professional fund manager in the natural resource space…
Click here to learn about my premium research and investment ideas in Katusa’s Resource Opportunities.
Regards,
Marin

