
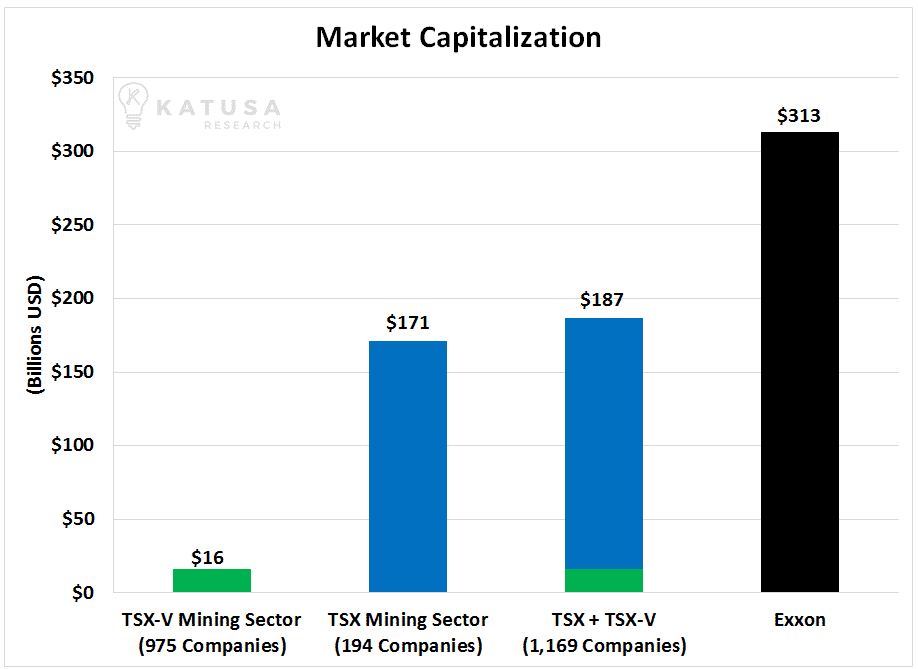
The energy industry absolutely dwarfs the mining industry.
In fact, a company like Exxon dwarfs all of the mining companies combined.
Every week, I get pitched by the last flock of people through the door trying to start a new junior company. It ranges from blockchain, marijuana and resource companies planning on going public… to companies looking to fund the next drill program that will change the game. If it’s funded and public, the bankers, financiers or entrepreneurs have come through our office with their best pitch.
Yet, the junior energy sector barely gets a whisper within the financing circles.
One sector that we here at Katusa Research are paying MAJOR attention to right now is the oil industry. And you should too. It’s a contrarians dream. It’s unloved, bleeding and left for dead.
And soon, I believe there will be once-in-a-generation bargains in bellwether companies. One day, we’ll look back and see them as amazing scores.
Even though crude oil prices are bouncing around, stock prices of some very solid companies are falling. Companies that were once industry behemoths are now bombing out.
Even great companies have seen their share prices lose over 50% of their market value over the past 12 months. These companies have solid people at the helm, cash in the bank and large proven resources in politically stable areas.
And I’m not talking about junior stocks going from 30 cents to 15 cents. There are multi-billion dollar market cap oil producers going from $60 to below $20. These companies employ thousands and thousands of people.
For example, I have my eye on one Canadian company that had its stock price shaved by nearly 60%. And I certainly see it going lower. But at some point, it will hit the floor and find a base.
This company is appetizing because it has many factors I look at. Among them, it has a solid portfolio of assets and it has excellent free cash flow. And in the near future, I know I’ll be able to pick up shares at predatory prices. It will pay me a healthy (and tax efficient) dividend to hold it until the next, big, stealth bull market phase in energy equities. And a company like this can deliver fast 100%-300% returns in 12 months.
Let me emphasize this again. You get paid a dividend while a multi-billion dollar market cap company triples like a junior. The point I am making is that major oil companies will be trading like juniors. Except you also get the asset base of a major oil company.
Here’s what many people fail to realize: A massive decline like the 2008 oil crash introduces a lot of emotion in the market. It catches most people off-guard. It produces big swings in their account values (usually to the downside). People begin to panic. Algo trading triggers stop losses. Frustrating emotions create markets that swing up and down with very little concern for fundamentals. You’ll see fund redemptions, lower prices, stop losses triggering more stop losses. Rinse and repeat.
During these times, it doesn’t matter if an asset is significantly undervalued. People go crazy. Trying to time market movements – like trying to catch a falling safe – can be very risky.
There’s a much lower-risk way to play markets in crisis. Knowing how to do it will give you a huge edge over others. It can be summed up simply as:
Don’t try to catch a falling safe. Wait for it to hit the sidewalk, bounce around and break open. Then walk over and pick up the money that is waiting for you.
Marin, can we make money in the oil markets over the next 12 months?
The washout in oil equities is happening. There will be consolidation and bankruptcies. Soon, we will buy shares in incredible companies, with excellent assets, at valuations not seen in decades.
So if oil prices are up, why aren’t the stock prices of most oil companies following suit?
Let’s get into it…
One of the main drivers for the rise in WTI oil prices since November comes from the decline in onshore U.S. oil inventories. The chart below shows the quantity of oil held in U.S. inventories.
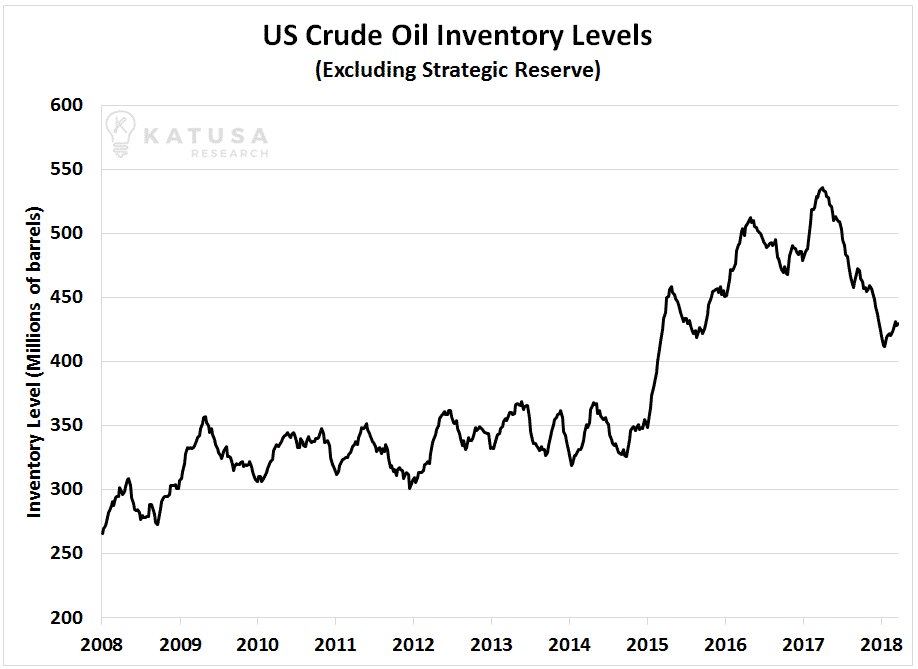
The decline in U.S. crude oil inventories pushed the price of crude higher. News outlets and “industry experts” say that this is because demand is outpacing supply.
I see it differently, let me explain…
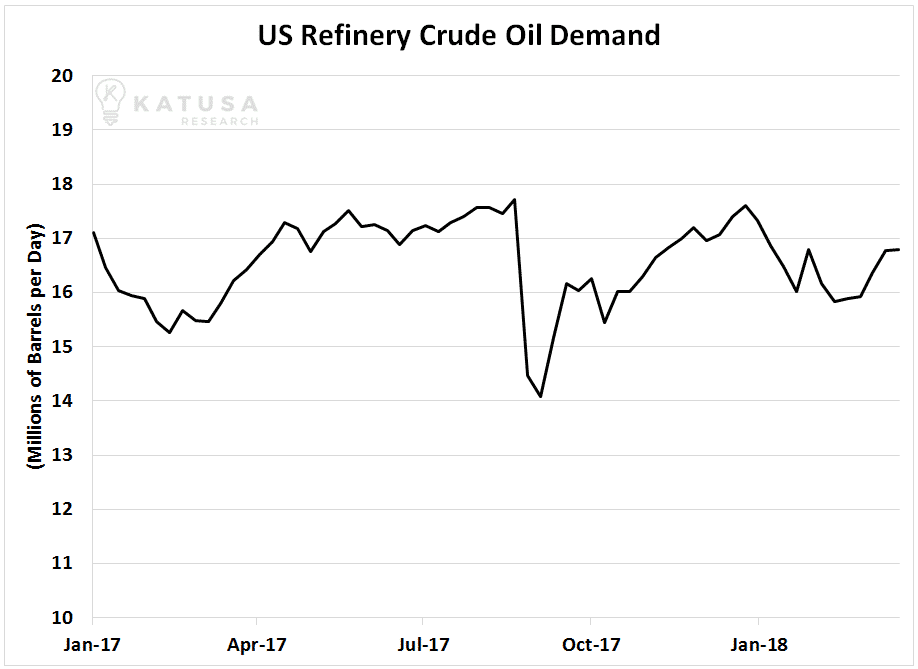
First off, the largest driver of U.S. crude oil demand is the refinery sector.
U.S. crude inventories fell by nearly 100 million barrels since June of 2017. Oil bulls are citing increased oil consumption as the reason.
If that was the case, it would make sense that refiners would have increased crude consumption on a proportional basis. However, this is not what the chart below indicates. In fact, it indicates that the U.S. refinery demand for crude has hardly budged over the past year.
Historically, oil was held in inventory for security purposes. Back in 1975, the U.S. government enacted the Strategic Petroleum Reserve. This made Americans safe from a repeat of the harsh effects of the 1973-1974 Middle East oil crisis. From the 1970s through to 2011, Americans were reliant upon Middle Eastern crude oil.
But thanks to shale oil production, Americans are no longer at the mercy of OPEC. Russia and Saudi Arabia just announced a new super-cartel to combat the U.S. But this will not dethrone the huge technological advances available to U.S. production.
The U.S. government and American refiners do not feel the need to keep large volumes of crude on hand. Why? Because there are large quantities of crude oil produced domestically.
The U.S. government openly said that it will be reducing its strategic holdings. It is expected that American companies like Continental Resources, EOG Resources, and Pioneer Energy will continue to thrive and produce large quantities of crude on home soil. (Note: I don’t own any of these companies).
So if American refinery consumption has not increased, and inventories are being depleted, where is all this crude going?
The simple answer is it is being exported to China.
At the start of 2017, the Chinese imported 65,000 barrels of oil per day from the United States. By October 2017, U.S. exports to China skyrocketed 600% to 448,000 barrels of oil per day.
The chart below shows the growth in U.S. crude oil exports, you’ll see total exports has doubled in under a year.
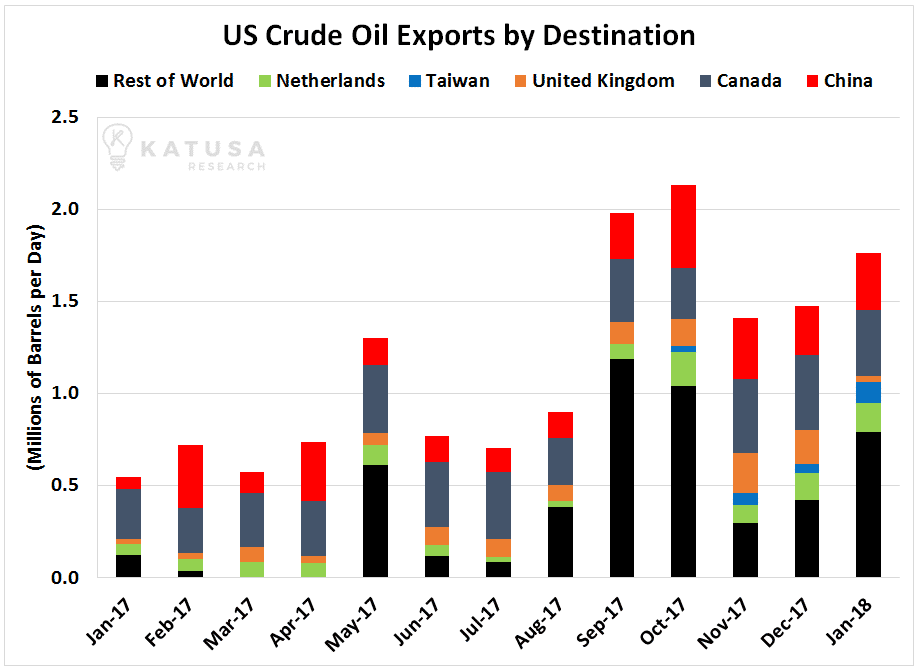
United States crude oil exports reached 2.1 million barrels per day in the final week of March 2018. The exports by destination data lags by several months. I’ll bet that when this export data is released, we’ll continue to see a large volume of crude oil being exported to China and to Taiwan.
China has been very public about building up its Strategic Petroleum Reserve. And it’s ironic to think that the U.S. is reducing its strategic petroleum reserves while boosting China’s.
The amount of oil held in floating storage is another under the radar indicator that I like to look at.
During periods of strong oil demand and rising crude prices, it is common that oil is stored in large container ships offshore. This is called floating storage.
Companies or oil trading funds will play an arbitrage on this. And here’s how they do it:
They purchase oil in the spot market at current prices. Then they store the crude on container ships for 6 to 12 months and then resell the crude with the expectation of higher prices down the road.
Depending on how long the crude is stored for, you need prices that are $4 to $6 per barrel higher in the future to cover the costs of storing the crude oil.
The chart below shows the quantity of oil held in floating storage.
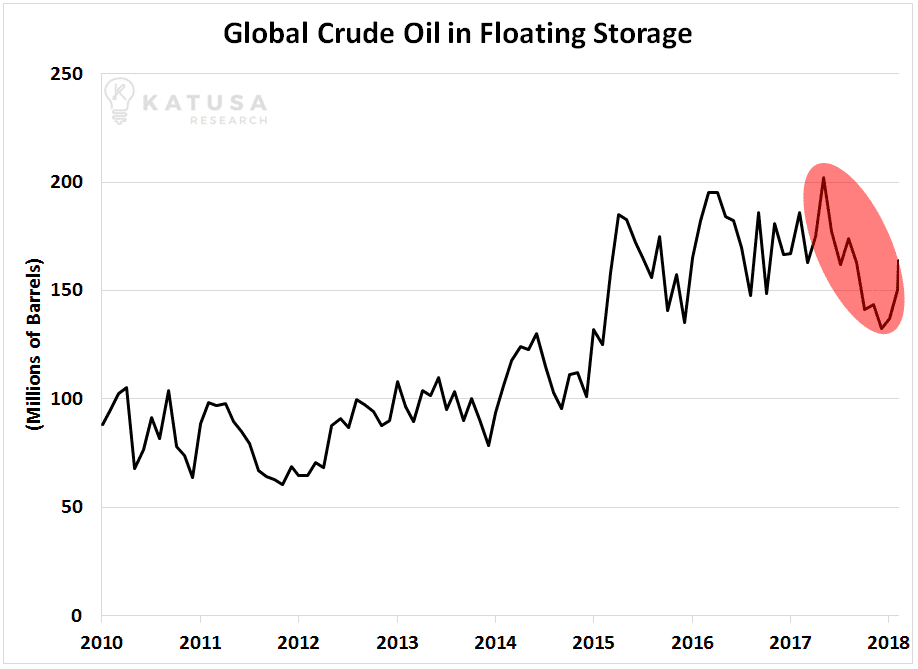
The significant declines in floating storage over the past six months indicates the lack of willingness to bet on higher prices 6 to 12 months from now.
The market isn’t paying attention to the fact that we are in backwardation. This means the market rate is higher than the expected price in the future.
So the “smart” money is selling as much crude as they can now at spot prices because they believe the future price of oil will be lower than it is today.
Do we know where the price of oil is going? Yes – there are some clues with the Futures Curve…
The chart below shows the futures curve for oil prices. The futures curve is a set of expected future prices for crude oil. These are prices that companies or trading institutions are willing to buy and sell from each other. These prices change every day. Below, is a chart of the current price expectations in red and the price expectations 6 months ago appear in green.
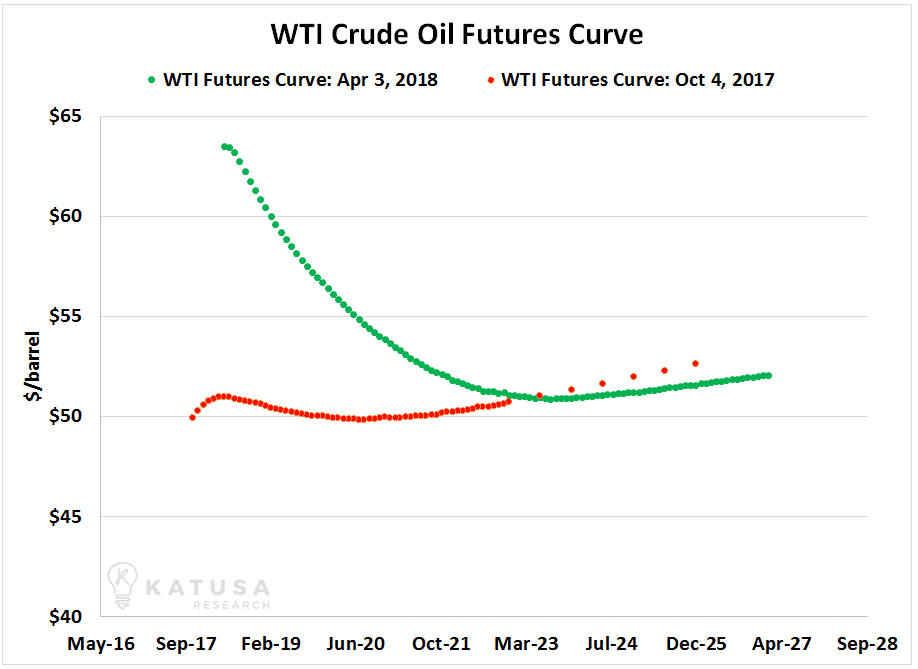
The change in the medium-term mindset is striking. Let’s take a look at the WTI futures curve from 6 months ago. Crude oil for June 2018 delivery traded for $51 per barrel. Using the April 3, 2018 futures curve, that same barrel is now trading for $63.
However, the long-term forecast for crude oil prices is similar, near $53 per barrel.
This means that the market expects crude prices to drop 15% between now and January 2021. The correction may happen sooner. Or not at all. But our strategy is this: Find positions in the most undervalued oil equities that can survive $40 oil and profit at $50 oil.
Oil Market Investment Guidance
These charts are telling me that we are in a new oil environment.
I believe Oil prices will remain range bound between $50 and $65 per barrel. Unless chaos erupts in the Middle East or in Russia. I also expect U.S. oil inventories to continue to decline. And I see the inventory decline coming from refiners reducing mandated storage levels and not due to massive new demand. Again, there’s no shortage of oil, refiners know it and producers know it.
Best in breed oil companies will do well in this price environment.
There’s one thing I won’t do in this oil environment. I have no interest in going into exotic frontier oil fields with no infrastructure. These locations need intense capex. I am also staying away from dry gas producers because high production costs and transportation issues don’t interest me. These are some of the factors I consider as I build my hit list of oil companies to buy like an alligator in the near future.
Technology continues to improve in the oil patch, and costs are continuing to decrease. The biggest profit opportunities in the sector right now come from liquid-rich plays that are in the lowest cost range with significant upside. That’s where I’m putting a lot of my own money right now. The balance sheet matters now more than ever before in the oil patch. Make sure you aren’t caught on the wrong side of the ledger!
To kick-start your research in this sector, I’ve made it easy for you… Check out my Market Intelligence Center and the Oil Stock Value Monitor.
I spend $100,000+ per year to access the best data in the world. My team then sifts through multiple data sets, screens and monitors to highlight select companies. Best of all, you don’t have to pay a thing for this service.
Regards,
Marin
P.S. Now if you want to know exactly what I’m buying… My top speculative oil stock is up nearly 100% since my initial recommendation to subscribers. I see another 100% upside in the next 12 months. And I would not be surprised if a major oil company bought it out sooner than that. I just published my exact thesis for this speculation in this week’s April issue of Katusa’s Resource Opportunities. To become a subscriber click here.
