Is it too good to be true for gold? Or is this “it”?
Under the leadership of Kim Jong Un’s sister, North Korea just blew up a South Korean liaison office. Talk about making a debut!
There are growing tensions between India and China at a Himalayan border which led to at least 20 deaths.
Another increase in coronavirus cases is erupting in many countries and even some U.S. states (Florida and Nevada are seeing daily cases rise).
If civil unrest was measured like the VIX Volatility Index is in stocks, we’d be at all-time highs.
And we haven’t even started getting into threats of draining the swamp, a ramp up in election coverage or mail-in ballot controversies.
The stock market does not seem to care. But gold is still at elevated levels, seemingly looking to make a breakout.
To recap where we’re at:
Unlimited stimulus by governments and central banks,
Deteriorating government relationships between superpowers,
Pandemic that has killed over 448,000 people with over 8 million cases.
Now let’s rewind for a second…
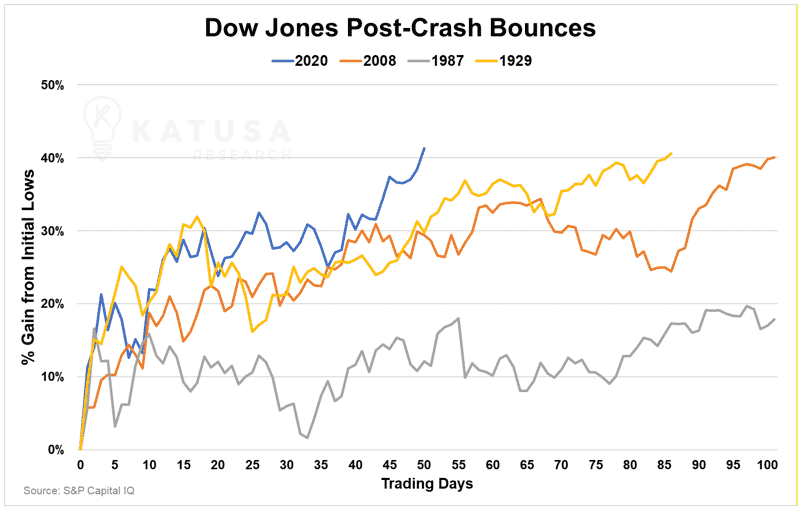
In a surprise move on March 15th, the US Federal Reserve announced its first monetary stimulus package.
Considering the planned meeting was for the Tuesday, the world took it that things must be “really bad” if the Fed had to announce its plans two days early.
Unsurprisingly, the market went limit down overnight on Sunday, and cratered after the open. But by noon, momentum had switched and the “buy the dip” trade was on in full force.
While not a “goal” of the U.S. Federal Reserve, the shockwave sent through the market was significant. It has fueled the fastest and most significant rally seen after any major economic correction.
An Election Year for the Ages
In normal times, these kinds of geopolitical developments can roil global markets.
And the fact that the market’s reaction has been muted is worrying. Investors can only account for so much risk and uncertainty.
Regardless of who wins, this election will be unlike any other in post-WWII history.
A heavy reliance on mail-in ballots, court challenges and recounts could result in uncertainty not seen since the 2000 Presidential Election.
One thing that has happened historically is that when the stock market goes up, gold prices go down and vice-versa. This may be seen as a silver lining for those gold bugs who fear that a Biden Presidency with Elizabeth Warren as VP would be decidedly less business friendly.
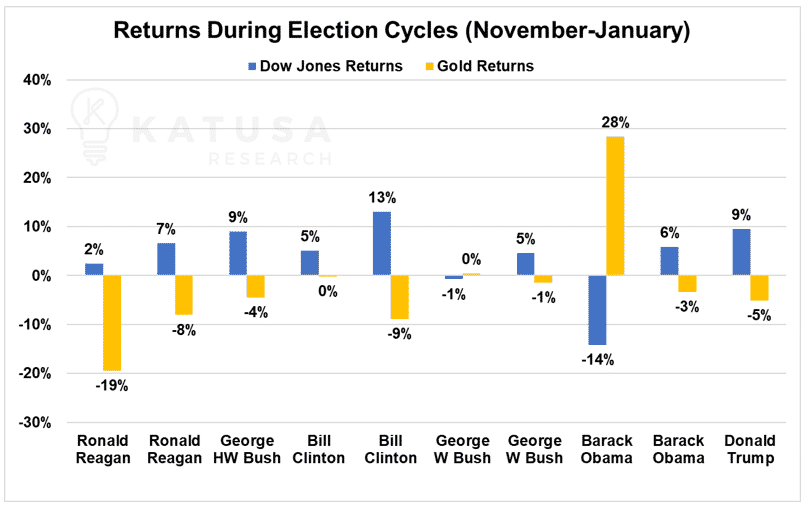
So how does gold perform in election years?
The usual answer – not very good, except for 2008 (the last time there was chaos).
In the 2008 election cycle, the election of Barack Obama was tepidly received by the stock market (which was already reeling from a financial crisis) while gold prices surged 28%.
Gold Continues to Outperform in 2020
Lately, many investors have been trying to trade the intraday chaos in the Nasdaq and even bankrupt names. Picking up pennies in front of a steamroller only works for so long.
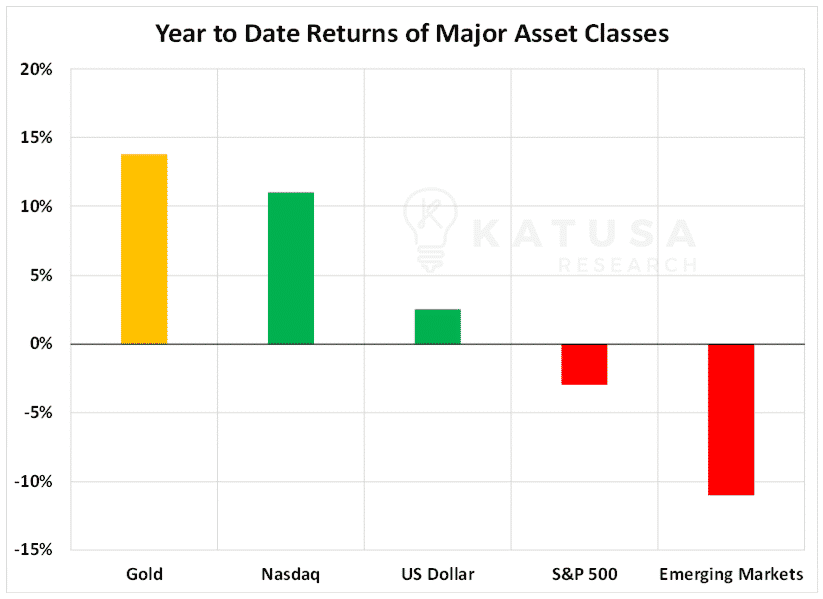
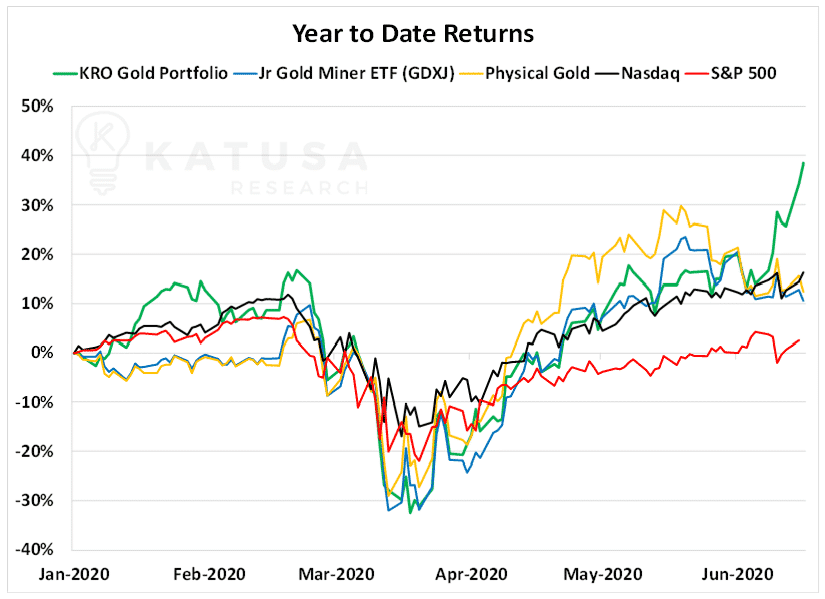
In the long term, a focused mindset is critical to achieving investment success. On a year to date basis, gold is leading the pack across major asset classes.
Gold has been one of the best performers YTD (yes, I’m aware Bitcoin is up ~30%).
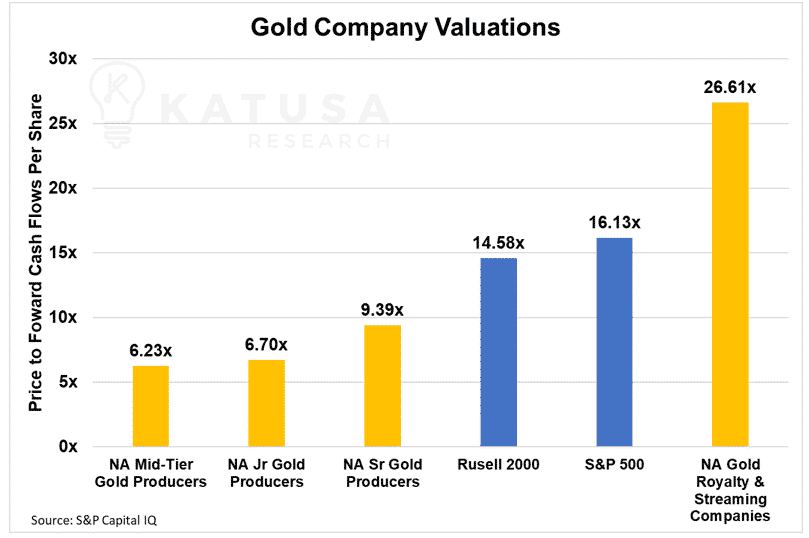
While physical gold and gold stocks have exploded higher, gold focused producers are still cheap.
The best multiple for demonstrating this is a Price to Cash Flow multiple.
I like to use cash flow rather than earnings because it’s much harder for a company to “goose the system” with fake earnings. Cash Flow from Operations does not lie.
Shown below is a comparison of Price to Cash Flow multiples.
As you can see, even if gold producers merely catch up to their peers in the Russell 2000, a major lift in mining equity prices is to come.
Gold Price Technical Analysis
I don’t base my investments and speculations on technical analysis, but I know that many traders do. So, I do factor them in.
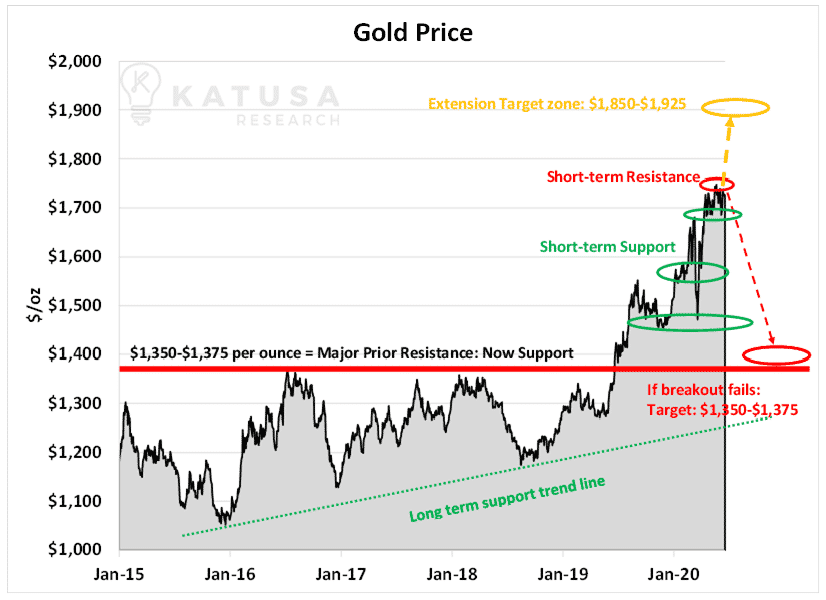
Gold has made a major move, from the $1,400 area to $1,700. Our subscribers have had an incredible year of gains as a result of our gold mining stocks.
Gold needs to build a strong support level around $1,700 per ounce, and it’s on its way in doing so. I do believe a breakout will come, but more time consolidating at these levels would be healthy.
I see two scenarios for gold in the near term:
Scenario 1: Gold bounces around the $1,650-1,750 range over the next 12-16 weeks and consolidates a base for the next leg higher.
Scenario 2: The Gold Price drops over the next 12-16 weeks.
If gold corrects, I’m prepared with my shopping list of companies to purchase my next tranches in the best of the best. This would be an opportunity to prepare for the next leg of the gold bull market.
Now let’s put the scenarios in visual form for some clarity. Here are my short-term support and resistance levels for gold.
Summertime Sessions – Is Gold Seasonal?
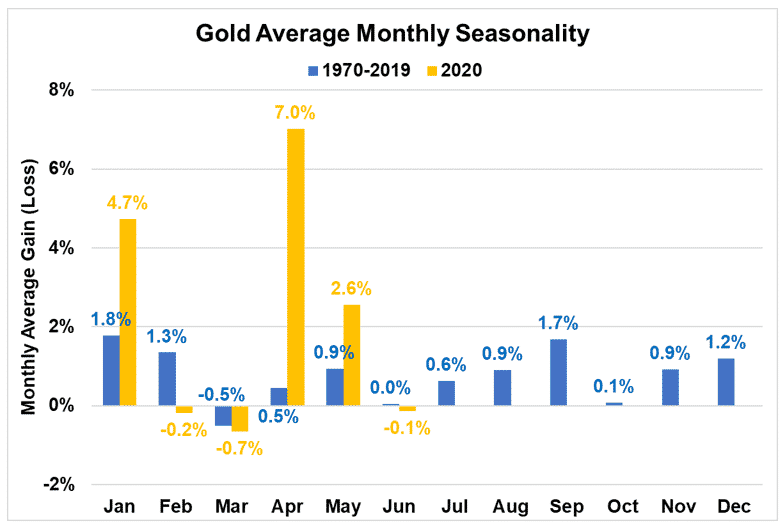
The next chart shows the monthly returns for gold since 1970.
Fifty years of data suggest that summer is supposed to be “boring” for gold.
The average return for gold in June, July and August is 0%, 0.6% and 0.9% respectively over the last 50 years.
But we know that this year is anything but normal. Coronavirus and Donald Trump are 2 huge wildcards that will keep everyone glued to their desk this summer.
And you’ll notice that gold has already had much wilder swings in 2020 than in years past. A surprise move up or down $100 is NOT out of the question.
Gold Goes Mainstream
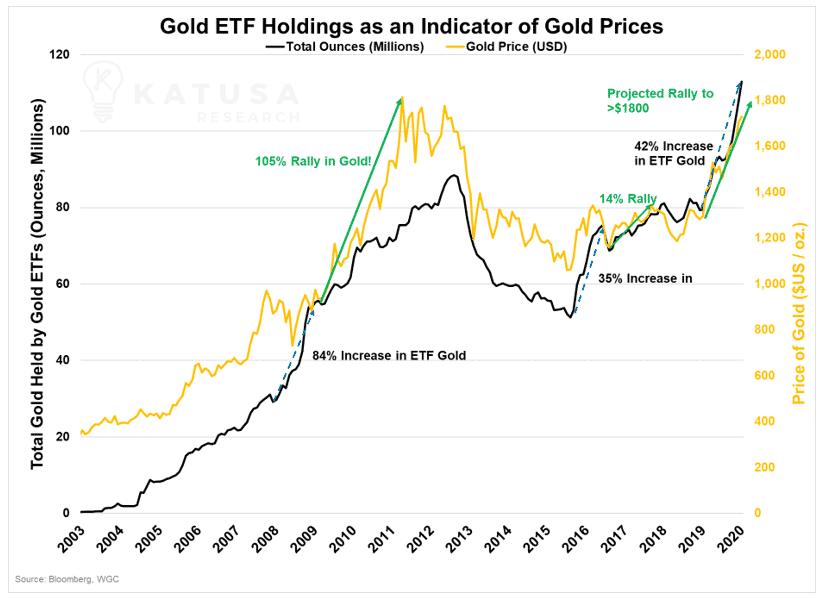
Gold holdings in ETFs are at record highs, in terms of tonnage and Assets Under Management (AUM).
Even the institutional shorts are starting to cover their gold short positions, with the most recent 100,000 contracts being covered.
Since April 2019, ETFs have increased their gold holdings by 42% or 33.5 M oz.:
You’ll notice that during the big run in gold prices from 2008-2011, as gold increased 105%, ETF holdings increased 84%. A 14% rally in gold prices in 2016 led to a 35% increase in ETF holdings.
So far in this run, gold is up 20% and ETF holdings are up over 40%.
Owning some physical gold is a good hedge investment.
But if you’re looking for bigger returns, you have to look into gold equities. These stocks are highly leveraged to changes in the gold price.
Below is a chart which compares the Katusa’s Resource Opportunities gold stock portfolio to mainstream ETFs and indices.
I’ve spent 2 decades in the business building relationships with some of the smartest and successful resource magnates. You cannot replicate this type of intellectual capital.
Even though a recent recommendation which was a buy in the open market is up 250% in the past few months, I’m not slowing down…
I’m working tirelessly on new investment ideas. And filling out all the government required paperwork to finally get to the airport and onto my next site visit… and hopefully my next big recommendation.
Legal Disclosure: By using this site, please assume Marin Katusa, Katusa Research and its employees have a financial interest in all companies and sectors mentioned on the website. The information provided is for informational purposes only and is not a recommendation to buy or sell any security. This is not financial advice.
We use cookies to ensure that we give you the best experience on our website. If you continue to use this site we will assume that you are happy with it.
You can revoke your consent any time using the Revoke consent button.