
Over the past 3 weeks, gold has perked up, rocketing nearly $100 per ounce. But is gold “ready” for its next leg higher?
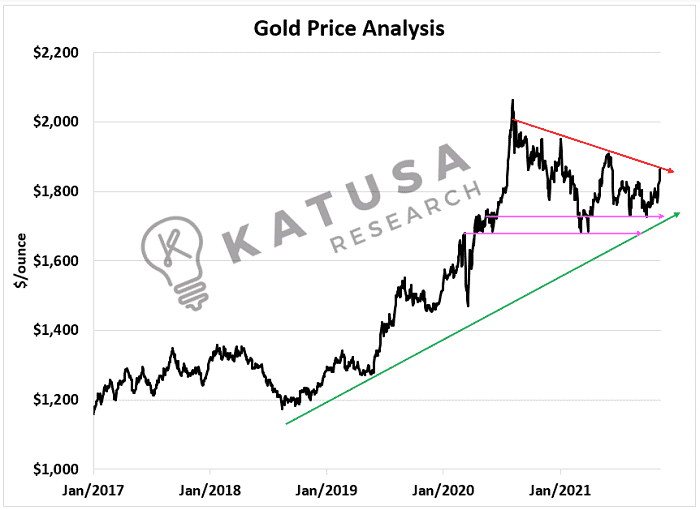
Like it or not, gold has been in a downward trend for over a year…
Lower highs have come with lower lows, leading to 12 months of falling prices.
Right now, the $1700-$1750 per ounce level remains a key short-term area of support for gold.
You’ll see that after its recent rise, prices are right smack into the resistance trendline.
But to truly understand if gold is ready to go higher, one must look deeper than support and resistance.
War of the Words: “Transitory” Inflation and Gold
As I have mentioned many times, we are in an era of quantum economics with ultra-low interest rates and a strong US Dollar.
- Blame it on the global supply chain, Central Bankers, or politicians, inflation has been running hot.
Regardless of whether this is “transient” or here to stay, it is making investors and the US Federal Reserve, uncomfortable.
In my book, The Rise of America, I discussed a phrase I coined called “CrossFlation” and that is exactly what has been playing out.
So, what does the U.S. Fed really think?
I think if you got a few glasses of vino into Jerome Powell off-camera…
He would admit that they have underestimated the supply chain issues which are a key root in today’s inflationary pressures.
I don’t have a crystal ball for inflation, and neither does the Federal Reserve…
But what I do know is that gold and commodities have the potential to perform very well in an inflationary environment. Let’s look into why this is the case.
The Consumer Price Index (CPI), which many uses as a barometer for inflation continue to soar.
The Fed’s preferred measure of Core-Personal Consumption Expenditures (PCE) while a lower absolute number also shows rising costs across the economy.
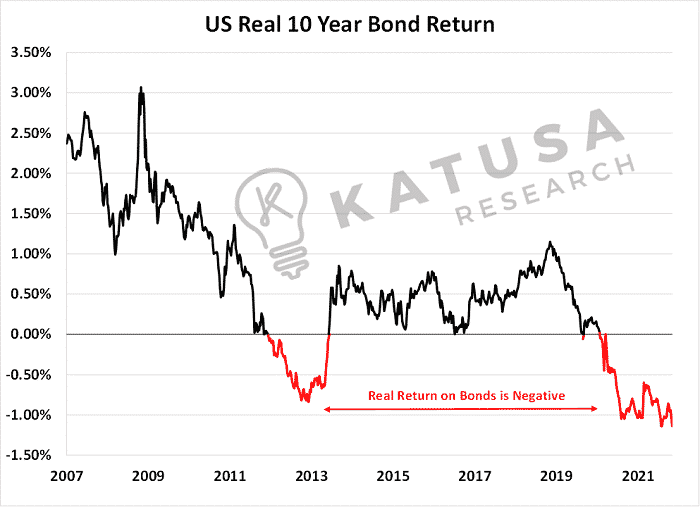
- Rising prices combined with near-zero interest rates create a “negative yield” in real terms.
Today “real” yields are -1.14%, within striking distance of all-time lows.
Real Yields and Gold
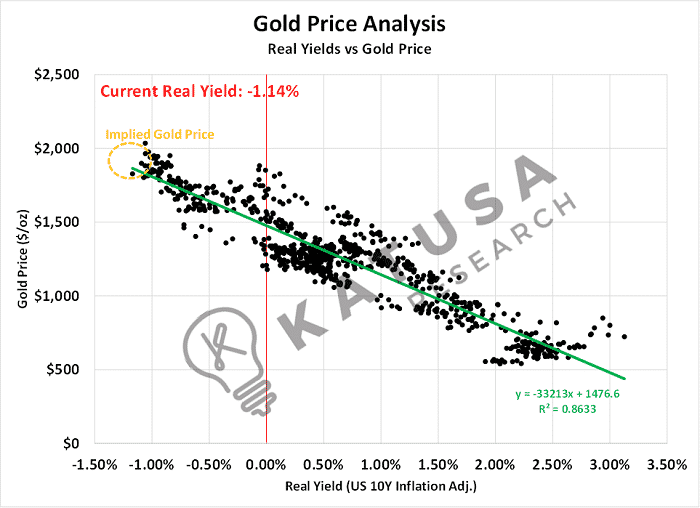
There is a simple yet very powerful relationship between real bond yields and gold (more on that here).
Gold has a storage cost, bonds have virtually no holding cost. So, if both are safe, you’d pick the one with the free storage cost.
- However, when bond yields are negative like they are today, bonds now have a “storage cost” which is higher than gold’s storage costs.
You can see in the chart below the powerful relationship that is exemplified. If real yields stay low or go lower, there is a strong supporting case for gold.
Gold Stocks are Up, But Well Below 52-Week Highs
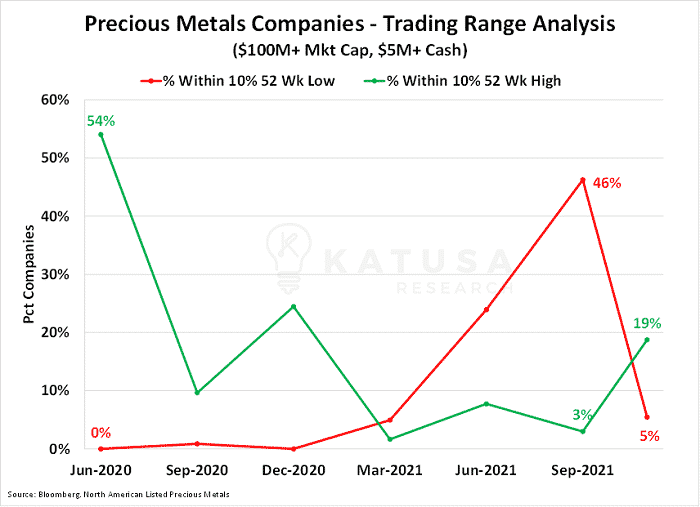
The prices for gold equities are rising…
And miner-focused ETFs are up double digits the past month – while the number of companies trading close to their 52-week low has plummeted.
This is a simple sentiment indicator that I like to keep on my radar.
Mining Cash Flows Go BRRRR…
Mining is a very tough business, so being able to take money off the table and recycle it at lower prices swings the risk-reward in the investors’ favor.
Many “gurus” mocked me for selling heavily across our portfolio when gold breached $2000 per ounce last year.
That’s fine, I don’t work for anyone other than myself and my subscribers.
Taking profits last year in the gold has allowed subscribers and me to be positioned like alligators – and to redeploy those gains and cash at prices well below where we were selling.
My favorite gold stock has more gold in reserves and resources plus a better production profile than it did last fall. Yet share prices are down 40% from where I sold last year.
The current gold market is exactly the gold market for alligators.
It’s the type of market where if you know what you are doing – and avoid the noise – the potential for big scores in de-risked companies is very probable.
Another gold position for subscribers that acted on an alert I sent has multiplied five-fold for all of us…
- Subscribers to my premium research letter – Katusa’s Resource Opportunities – are sitting on a 500% gain over the last year, even as gold has corrected from last year’s highs.
Not to mention, among all the crypto and tech hype…
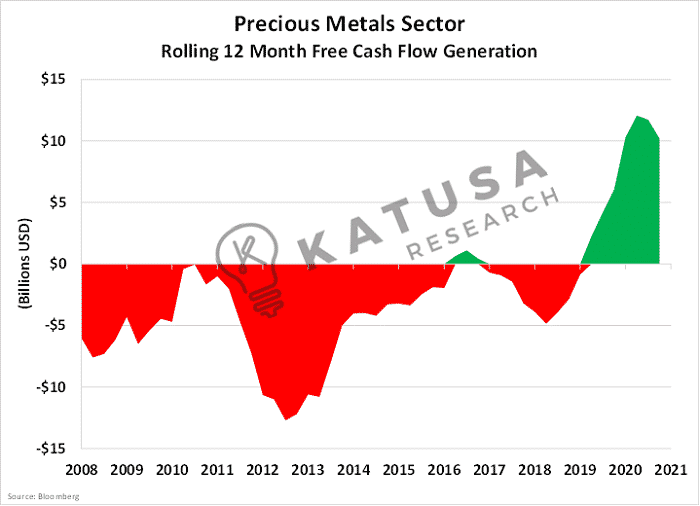
Precious metals producers are printing money at a fever pace.
The chart below shows the cumulative free cash flow generation for North American precious metals companies.
You can see that for a decade straight, the industry was a black hole for capital.
Now, the sector has strung together multiple massive quarters and bolstered battered balance sheets.
Miners today are laser-focused on efficiency and cost control.
Technology today allows for optimized mine plans and ore sorting, which lowers production costs per ounce.
The average all-in sustaining cost per ounce produced for senior and mid-cap gold producers is $1,100 per ounce.
Today’s gold price is $1850, leaving $750 per ounce in potential free cash flow.
These are incredibly healthy margins for gold producers.
As I mentioned, subscribers and I have been begun to gobble back positions we took profits on last year in the gold space.
- In just 3 months, one of our gold stock tranches is up 31%, and gold only went up 7.5%
I still see tremendous upside for all our core precious metals holdings.
And you have only seen a whiff of what’s coming in the ultimate gold and commodities bull market.
If you felt like you missed out on some great opportunities in 2021…
And want to give your portfolio an edge in 2022 – consider learning more about what I’m focused on in the KRO.
Every month I put together a research journal full of data that everyone can understand – and opportunities that you can take advantage of… today.
It’s called the KRO, and there’s a reason it’s read by some of the most prominent family offices, professionals, traders, investment bankers, and brokers in the world.
You can learn how to unlock access to it right here.
If you know, you know.
Regards,
Marin Katusa
