


The mid-terms are coming up, but major markets like the S&P 500 haven’t seen a major market correction in a long time.
If you bought anything in the last week of March, you own a reflex now.
So far, it has paid.
The market fell hard that week, oil was over $100, and every headline said correction.
Three weeks later the index was back at a record, and whatever you bought on the way down was green.
That was the second time in a year.
- The tariff selloff of April 2025 was deeper and scarier, and it healed faster than any drop that size in the history of the index.
Twice now, buying the drop has paid inside a quarter. And a habit that pays twice stops feeling like a bet.
Seventeen Months is Average…
Since the April 2025 low, the S&P 500 has gone 17 months without a 10% correction.
I keep seeing that number used as proof one is overdue, usually by someone who is already fully invested.
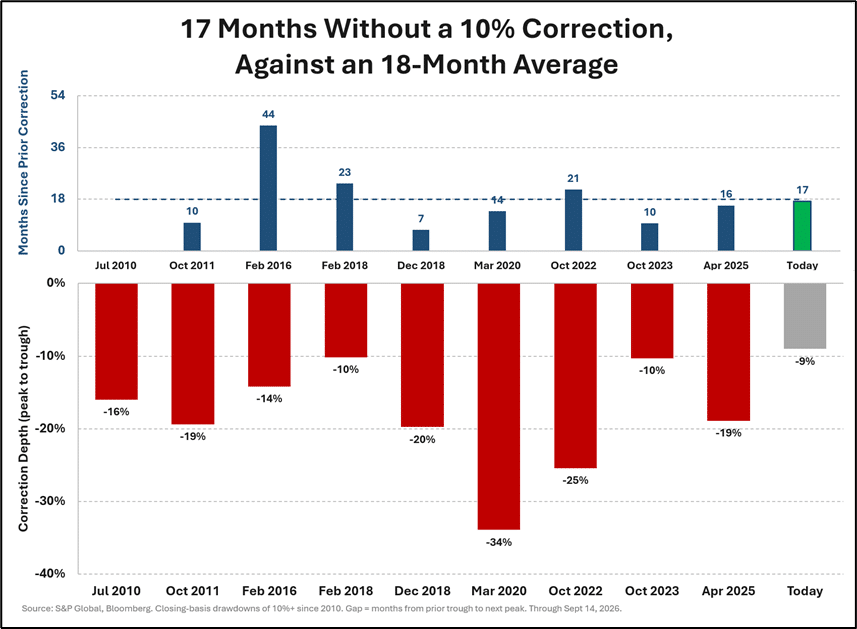
Since 2010, there have been nine corrections. The wait between them ran from seven months to 44 and averaged 18.
- Seventeen sits on the average (but note that the average has never predicted a date).
The more useful number is where the last two dips stopped.
The autumn 2023 dip made it to ten percent down, and this March turned at nine, before it got there.
Every time the reflex fired, the market paid it.
The Buffett Indicator: Flashing Red
Named after Warren Buffett, this simple ratio compares the total value of the stock market to the size of the U.S. economy (GDP).
- Currently, this indicator stands at 2.06, a LOT higher than its historical average of 1.08.
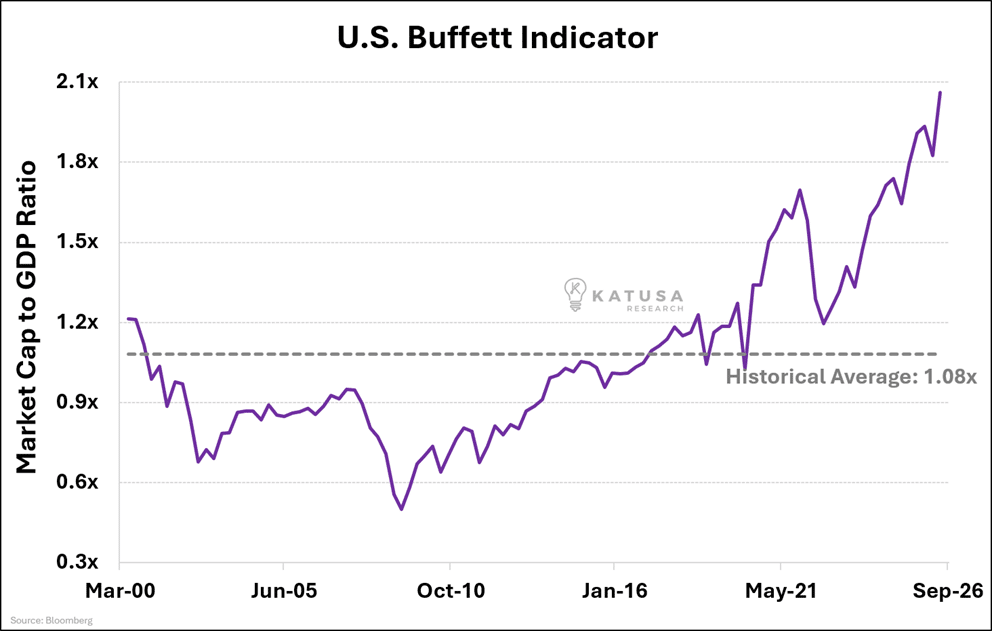
- The stock market is still currently valued at more than twice the size of the entire U.S. economy.
Even allowing for how global American companies have become, no reading in the dot-com years came close.
Shiller CAPE: Lofty Territory
The second gauge is Shiller’s CAPE.
It asks what you pay for ten years of inflation-adjusted profits, the way a buyer of a business asks for a decade of tax returns instead of last quarter’s brochure.
- The current CAPE ratio stands at 40.58, more than double its historical average of 17.79.
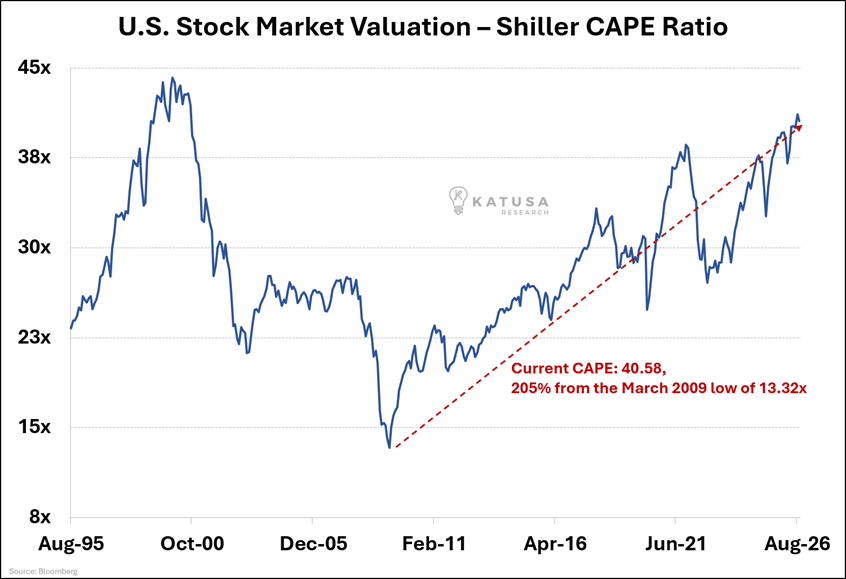
Only 20 months since 1881 have printed higher, every one of them in 1999, 2000 or this year.
By either measure, stocks are historically expensive, and every buyer who fired the reflex this year paid these prices to do it.
Yield to the Boss
For fifteen years, expensive stocks had an alibi.
Bonds paid almost nothing, so a 40x CAPE could hang around because the alternative was worse.
That alibi ran out this week when the 10-year Treasury closed above 5% for the first time since 2007. And on Wednesday, the Fed raised rates for the first time in three years.
The S&P 500 trades at 21.1 times next year’s expected earnings.
Flip that over, and the index yields 4.7% on profits nobody has earned yet. While a 5% Treasury pays more on a coupon, the government has already promised.
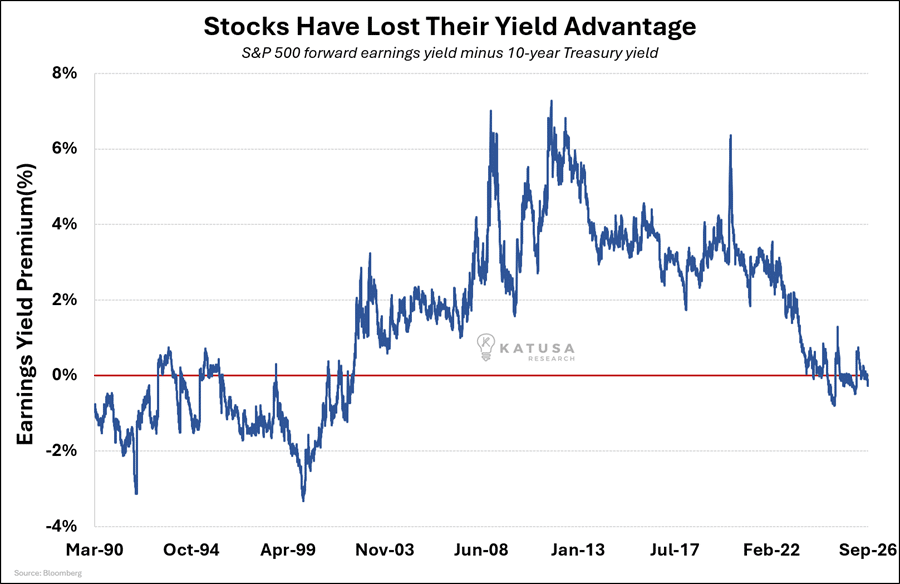
From 2009 to 2022, the index out-yielded the bond by three to seven points. That gap was the whole argument for paying up.
The spread has dipped below zero three times in this cycle:
- February 2025: -0.8%. Two months later, tariffs caused a 19% decline.
- February 2026: -0.5%. A March decline of about 9% followed shortly after.
- This week: -0.2% to -0.3%, and the bond market is still selling.
That was two warnings, with two corrections… and the third is flashing as I write this.
The 10-year may not hold 5% for long, and it doesn’t need to.
A 5% coupon against a stock market earning 4.7% means you’re taking equity risk and getting paid less than the government pays you to do nothing.
Before 2023, the last two times that happened were 2000 and 2007. A bond fixes its yield with a rally.
A stock market fixes its yield with a lower price.
Get Your Shopping List Ready…
Set the measures side by side.
The market is worth twice the economy, the CAPE sits above 40, we’re 17 months past the last 10% correction, and a Treasury pays more than the S&P 500 earns.
Nothing in this market is screaming “cheap”.
Yes, there’s been a pullback, but it’s more of a sneeze than a flush.
This isn’t the time to go all-in, but it is the time to be building your watchlist and stalking stocks like an alligator.
Here’s what I’m doing personally:
- Maintaining cash for potential screaming buying opportunities
- Being selective about stock purchases: focusing on companies with strong balance sheets and reasonable valuations
- Preparing for increased volatility as markets eventually readjust to more sustainable valuations
The names on the current list, with prices beside them, are in the September issue of Katusa’s Resource Opportunities.
This is the issue.
Regards,
Marin Katusa
Get real-time alerts right away. Follow on X: @KatusaResearch and @MarinKatusa
Details and Disclosures
Investing can have large potential rewards, but it can also have large potential risks. You must be aware of the risks and be willing to accept them in order to invest in financial instruments, including stocks, options, and futures. Katusa Research makes every best effort in adhering to publishing exemptions and securities laws.
By reading this, you agree to all of the following: You understand this to be an expression of opinions and NOT professional advice. You are solely responsible for the use of any content and hold Katusa Research, and all partners, members, and affiliates harmless in any event or claim.
If you purchase anything through a link in this email, you should assume that we have an affiliate relationship with the company providing the product or service that you purchase, and that we will be paid in some way. We recommend that you do your own independent research before purchasing anything.