On August 27th, 1859, George Bissel and Edwin Drake changed the American petroleum industry forever.
The two men were responsible for the first successful use of a drilling rig for a commercial well. Drilled especially for oil.
Named the Drake well, and drilled to a whopping depth of 69 feet, it took Titusville, Pennsylvania by storm.
And set the course for investment and speculation in the oil industry.
You might not know this, but the history of drilling for oil predates Bissel and Drake by at least 1,500 years.
- The earliest known wells, discovered in China, date to AD 350 and were drilled out to depths of up to 800 feet by using drill bits attached to bamboo poles.
But Drake’s well stands out from its predecessors for several reasons:
Before this point in the U.S., oil was only collected where it seeped to the surface, such as in northwestern Pennsylvania where it was skimmed from the tops of ponds.

Drake chose to utilize a salt-well drilling technique. So, rather than digging by hand, he had a salt-drilling crew use a 6-horsepower steam engine to push the drill bit down to the bedrock.
He then used a cast iron pipe to case the well, keeping the soil from falling into the hole.
Drake’s well was also one of the first commercial oil wells, drilled for the Seneca Oil Company, unlike many of the wells dug out in antiquity.

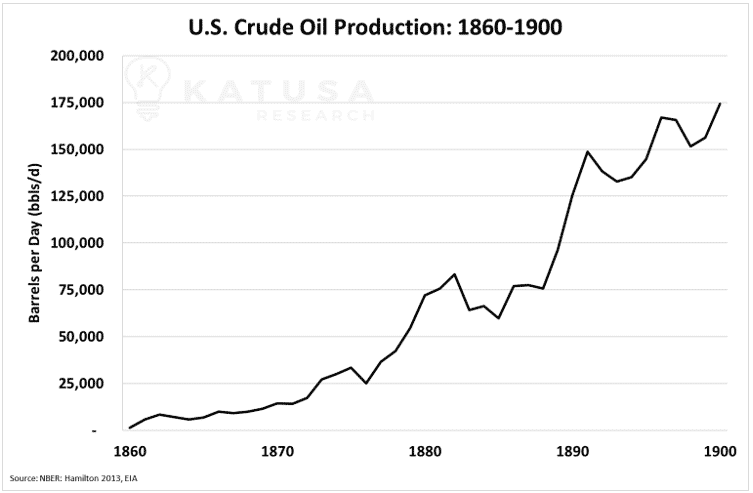
- U.S. commercial oil production effectively started when the Drake well was spud.
In the following 40 years to 1900, production quickly ramped up to 175,000 barrels per day.

The Age of Oil
The following century from 1900 to 2000 was truly oil’s time.
Oil was originally used primarily for lighting oil lamps. But it was the invention and widespread adoption of the internal combustion engine that really skyrocketed the demand for oil to where it sits today.
Technology and capital raced into the sector, continuously pushing the boundaries of hydrocarbon recovery.
- In the first 40 years from 1900-1940, U.S. oil production soared from 175,000 barrels per day to over 4 million barrels per day.
And by the time the century was over, oil production in the United States had reached a high of 9.4 million barrels per day.

Not to be outdone, the rest of the world has also pushed the envelope.
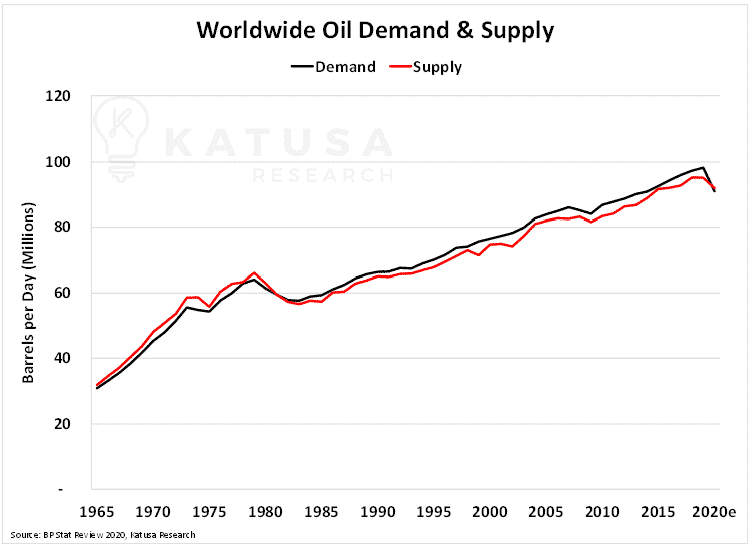
- Since the 1960s, worldwide crude oil production has tripled to over 90 million barrels per day, matching the soaring growth in demand.
Like it or not, crude oil and its refined products have now become intertwined in our everyday lives.
Endgame? Worldwide Oil Demand and Supply
From gasoline in the car and jet fuel for the planes, to single- and multi-use plastic products, crude oil is everywhere.

However, this year, oil demand came crashing to a halt as the global economy shut down due to the Covid-19 virus. Adjusted for the impact of the coronavirus pandemic, this year’s crude oil supply and demand are estimated to end around 92 million barrels per day.
That’s down from a high of 100 million barrels per day in 2019.

To date, British Petroleum (BP), Royal Dutch Shell (RDS.A), and Total SE, 3 of the world’s largest and most powerful oil companies, have all forecast significantly lower future oil demand.
According to the majors…
- Oil demand will peak around 2025-2026 and subsequently decline by as much as 50% by 2050.
It’s only a matter of time before the likes of Exxon and Chevron update their respective forecasts as well.
Below is a chart which shows the forecasts constructed by BP and Total, compared to Katusa Research’s own Aggressive Reduction case.

New Lows in North American Drilling Activity
The Baker Hughes Rig Count is a weekly census followed by oil traders, analysts and companies.
It tracks the number of offshore and onshore drilling rigs engaged in exploration and development of oil and natural gas projects.
The oil & gas E&P sector was so severely impacted this year by COVID-19, collapsing oil prices and excess capacity that the rig count recorded all-time record lows in both the United States and Canada.
- In August 2020, only 244 rigs were reported online in the United States. That’s a historic low since the data were first recorded in 1949, and a 77% decline in rig count YoY.
- In late June 2020, only 13 rigs were reported online in Canada – Also an all-time historical low with data dating back to 1964. And a 90% decline in rig count YoY.

ESG, Electric Vehicles and the Oil Demand Knockout Combo
The central themes around future crude oil demand are transportation first, with petrochemicals a distant second.
Transportation plays an enormous role in crude oil demand. Globally, transportation accounts for over 50% of crude oil demand.
But mass adoption is already on the horizon for electric passenger vehicles, with electric tractor trailers and buses following shortly after.
Electric mobility is a death knell for crude oil demand.
- Electric passenger vehicles alone will represent at least 10 million barrels per day of lost crude oil demand.
Petrochemical demand is expected to increase over the next decade. However, increased recycling of plastic products and eventual bans on single use plastics (SUPs) will likely neutralize any demand increase.
With expectations of 50% of global oil demand evaporating over the next 30 years to 50 years, oil majors are turning to different avenues to replace their oil revenues.
- Total SE, Shell and BP have all telegraphed their foray into green power and clean technologies.
It’s a remarkable, and very expensive, pivot for the companies as the oil companies cost of capital has risen significantly from just a few years ago.
But in this case, they have no choice – it’s either adapt or die.
In addition, access to capital is getting harder and harder for oil companies to source.
Investment funds have stricter protocols in place now for investing in “green” companies, and companies with strong ESG (Environmental, Social, and Corporate Governance) profiles.
For the most part, oil companies don’t fit those mandates. In other words, their well of capital is rapidly drying up.
Perhaps the best example of the well drying up can be seen by examining fund flow.
In the next chart you’ll see the cumulative net creation or redemption, by month, for U.S. listed ESG ETFs with a market capitalization greater than $1 billion versus the oil & gas + MLP (Master Limited Partnerships) universe. It works out to the Top 10 ETFs in each sector going head to head.
The difference is remarkable and paints a very ugly picture for the oil sector.

Now, I’ll be the first to admit that many of these ‘ESG’ favorites are high flying tech stocks, but either way, it shows where the capital is flowing these days.
At Critical Junctures Like This… There’s Serious Money to be Made
If you’re a serious oil and gas investor who’s found themselves surprised by this article…
Or if maybe you “just don’t believe it” …
Then you should consider becoming a member of Katusa Research.
After all, even the oil supermajors have already seen the writing on the wall. And they’re already working on diversifying their asset portfolios away from oil and gas.
It’s a lesson any energy or resource investor should take to heart.
- Right now, I have 2 resource stocks that I’m waiting to pounce on, both of which I believe have world-class tier 1 category assets.
Our portfolio has been rocking this year and regardless of who wins the U.S. election, there will be plenty of opportunities. And I’m excited and ready to put the profits and free-rides we’ve taken over the past few months to work.
You can join me by becoming a subscriber to Katusa’s Resource Opportunities today.
Regards,
Marin


