
The US Federal Reserve’s March policy meeting set the tone.
The Federal Open Market Committee (FOMC) announced plans for three rate cuts by the end of 2024, aligning with investor expectations.
Right now, markets are pricing in a 17% chance of a rate cut at the June FOMC meeting.
Despite this, there’s still uncertainty regarding the economy’s direction and the potential for these rate cuts to be revised.
- Historically, commodities, as tracked by the Bloomberg commodities index, tend to perform well during rate-cutting cycles.
The chart below shows the Bloomberg commodities index in blue, and Fed rate cutting cycles in red.
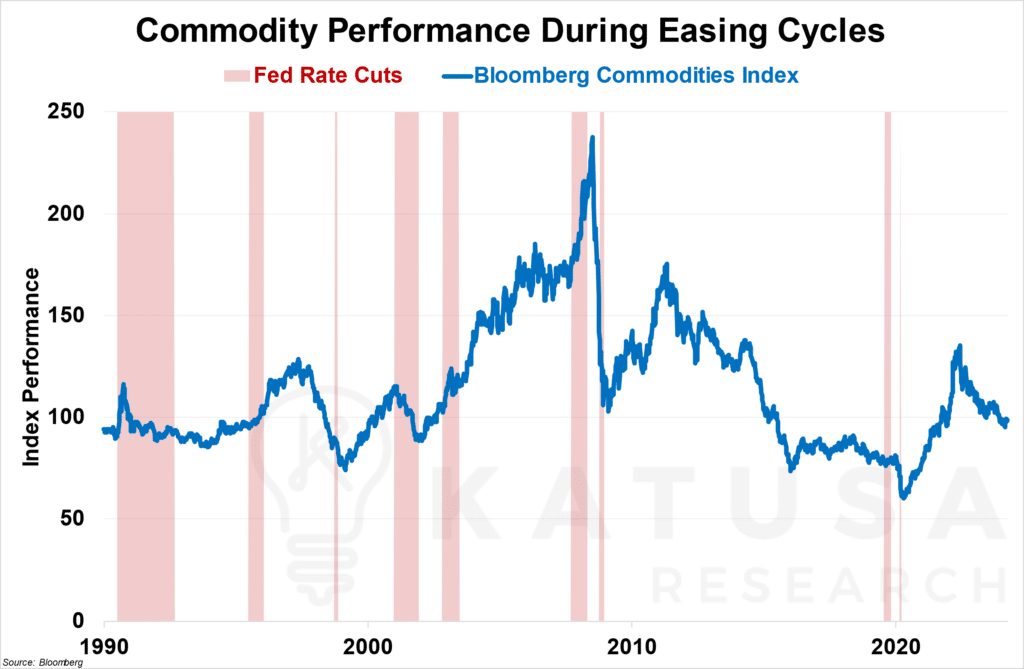
But with a few exceptions:
- The Asian Financial Crisis of 1997-98,
- Dot-Com Bubble burst of 2001,
- The Global Financial Crisis of 2008.
Outside of those three cases where major external events played a significant role…
The commodities index returned upwards of 15% on average in the months following the beginning of each easing cycle.
In addition, the commodities index also usually made significant gains within a few months following the end of an easing cycle, outside of the Gulf War Recession of 1990-91.
Of all the commodities, however, one that’s particularly important to focus on is copper.
Dubbed “Doctor Copper” for its ability to gauge economic health…
As one of the key building blocks of our modern society, if there’s any commodity you’d expect to lead the way in a commodity rally, it’d be copper.
Paging Doctor Copper: A Health Checkup
Let’s take a closer look at how copper specifically has been doing recently.
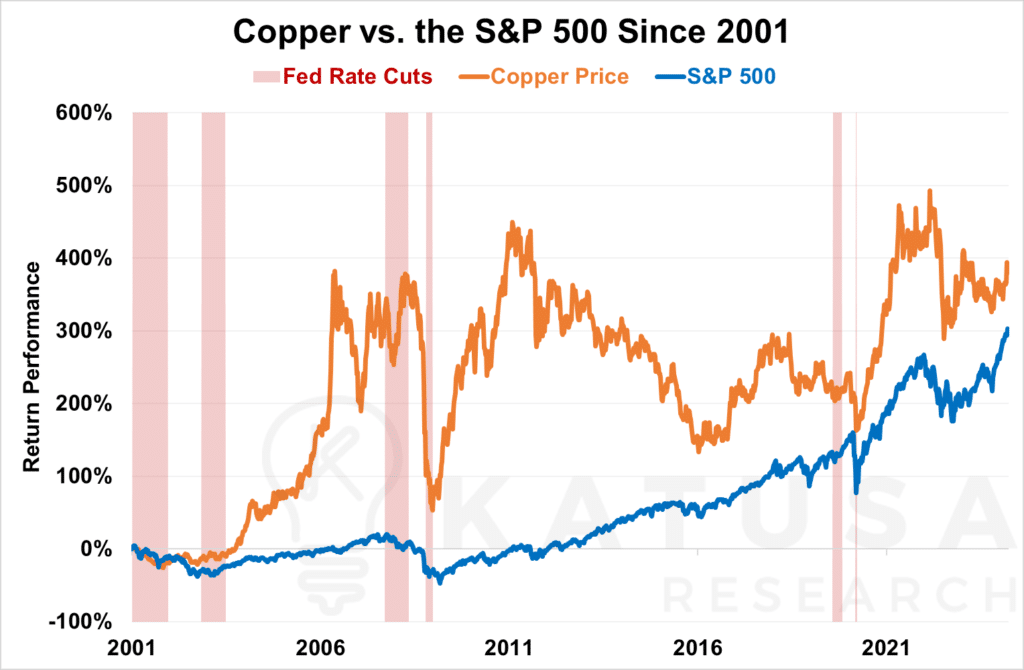
Though it’s also seen several years-long periods of sustained price declines in-between its peaks.
With a correlation of 0.54, copper prices and stock markets aren’t perfectly aligned, but copper remains a reliable barometer for economic trends.
Also overlaid on the chart are the last few rate cuts by the Fed. As you can see, many of the easing cycles overlapped or were directly followed by strong copper price gains.
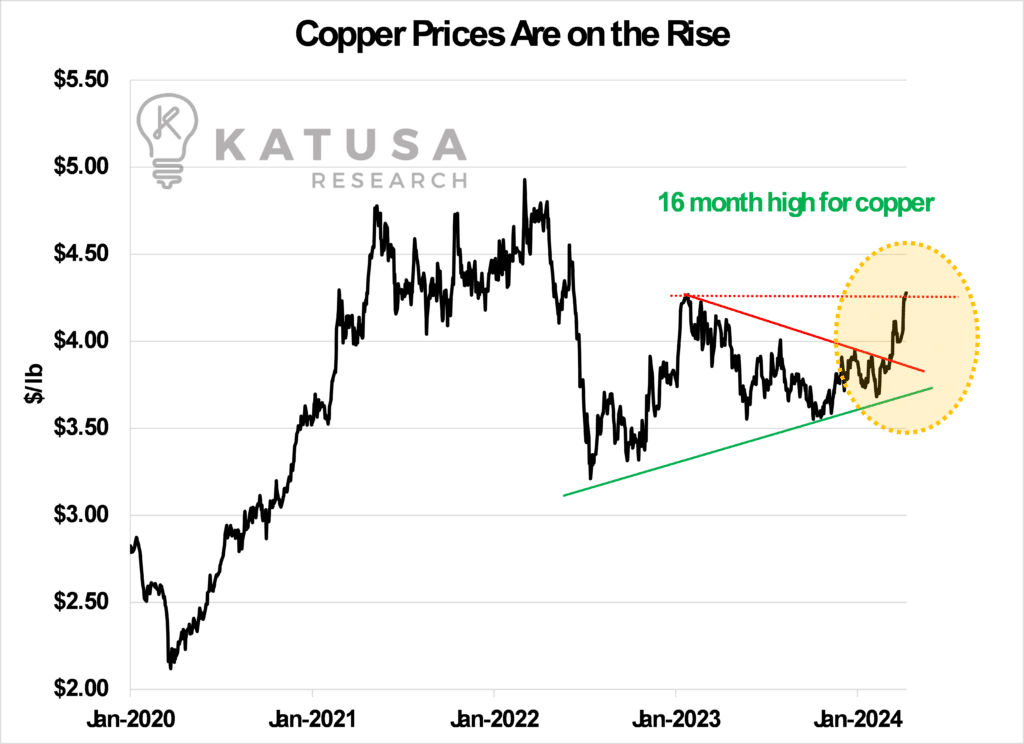
Now with the recent confirmation from the Feds of their plans for 2024, how has the copper market been reacting to the news?
In a word: strongly.
Copper prices have shot to 16-month highs over the past couple of weeks, breaking through its downtrend.
Copper Contracts Making Noise
At the London Metals Exchange, the world’s largest marketplace for copper contracts…
The net long position (total longs and shorts combined) taken by investment funds in copper jumped 41% following the news.
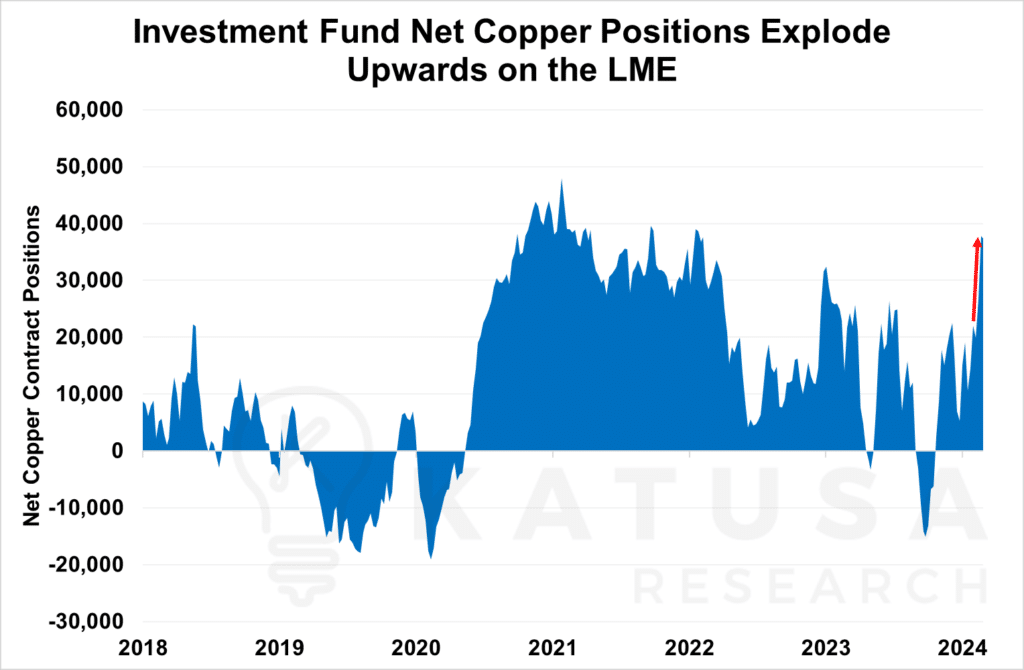
- 70,293 contracts is the biggest shared bet ever made by funds on copper prices going higher since the LME started publishing their Commitment of Traders report in 2018.
Things were similar at the Chicago Mercantile Exchange, where net non-commercial positions (contracts not bought for hedging production) rocked up to nearly 32,000 contracts long.
That’s a big reversal from the previous month, where net investment positions were actually short by roughly the same amount.
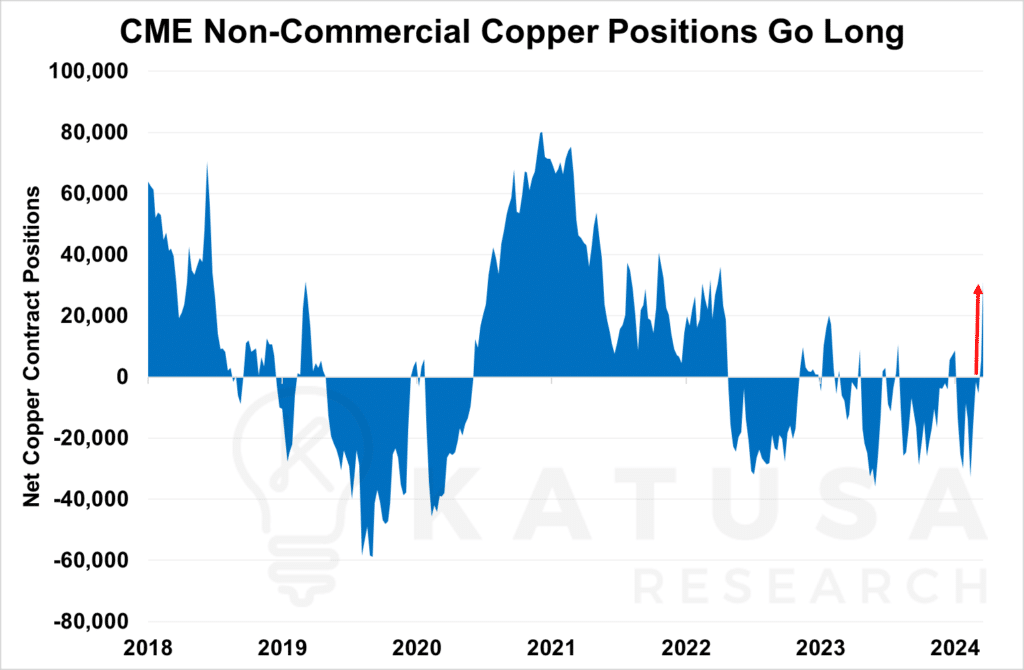
- Gross long positions in copper contracts from managed money on the CME also saw a 43% bump in the wake of the FOMC meeting, hitting highs not seen since May 2021.
And while China doesn’t publish any equivalent data for their Shanghai Futures Exchange, it’s worth noting that open interest (the total number of outstanding contracts) in copper futures in Shanghai surged 46% immediately following the news.
Copper Demand is Coming
Of course, even without the prospect of the next Fed easing cycle on the horizon, the forecast for copper is very bullish based solely on its strong fundamentals.
It’s forecast that copper demand could grow by nearly 10 million tonnes, representing roughly 35% growth.
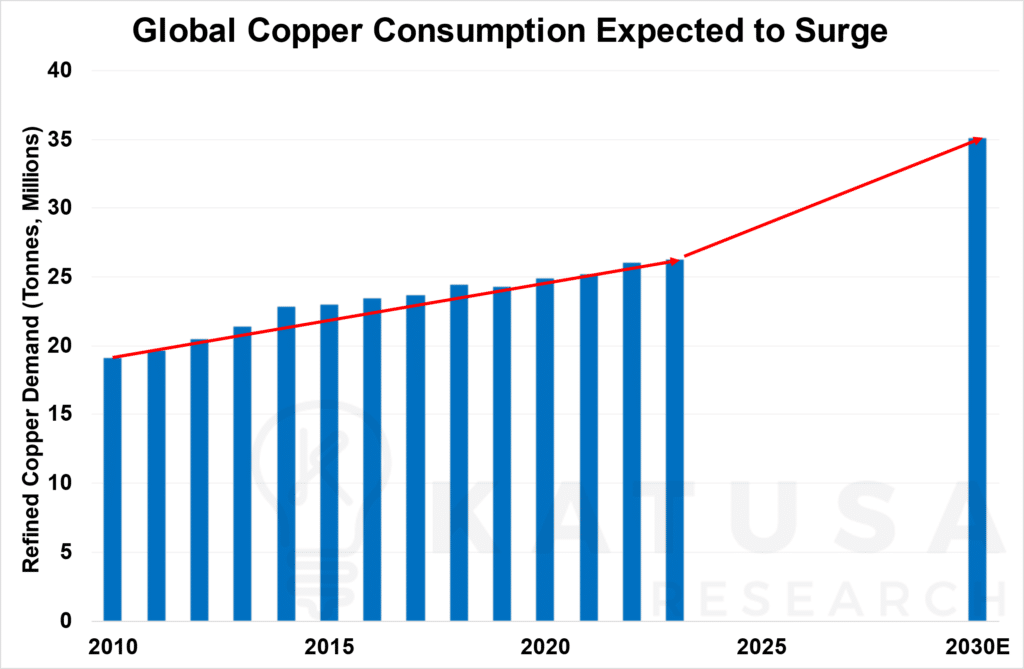
To put things into perspective the average annual growth in copper demand between 2010 and now is just 2.5%.
In other words:
- From here on out global demand for copper is expected to grow at twice the rate it has in the past decade and a half.
Copper is Instrumental in the Commodities Supercycle
If we consider the potential of a FOMC easing cycle added on top, things could look even better for copper.
Recall, the purpose of an easing cycle is to stimulate economic growth. Lowering rates incentivizes people and companies to borrow and grow.
This is why markets have historically tended to rally when rate cuts are announced by the Fed.
In the USA, massive investments in clean energy and power infrastructure upgrades need to be made, all of which will require vast quantities of copper.
The Biden administration recently allocated $3.5 billion for electric grid upgrades, signaling potential future investments.
This all comes at a time when some of the world’s largest copper mines are faltering.
Chile, once the Saudi Arabia of the copper world, hit a 25 year low in copper production in 2023.
High debt and low copper grades combined with a socialist stance have created a firestorm of challenges within the state run Chilean copper miner.
As I wrote several years ago, the world needs a lot more copper, but it’s not going to get it for $3 a pound.
A rate cutting cycle and a decline in Chilean production could be the key catalysts to drive copper prices higher.
Regards,
Marin Katusa and the Katusa Research Team
P.S. We just published a full analysis of the copper market in the recent April issue of Katusa’s Resource Opportunities – including one copper company Marin is targeting.
Details and Disclosures
Investing can have large potential rewards, but it can also have large potential risks. You must be aware of the risks and be willing to accept them in order to invest in financial instruments, including stocks, options, and futures. Katusa Research makes every best effort in adhering to publishing exemptions and securities laws. By reading this, you agree to all of the following: You understand this to be an expression of opinions and NOT professional advice. You are solely responsible for the use of any content and hold Katusa Research, and all partners, members, and affiliates harmless in any event or claim. If you purchase anything through a link in this email, you should assume that we have an affiliate relationship with the company providing the product or service that you purchase, and that we will be paid in some way. We recommend that you do your own independent research before purchasing anything.


