Almost no one saw it coming.
In 2014, the oil market witnessed a brutal collapse—from around $100 a barrel to half that price in mere months.
Now, we’re seeing two critical data points that echo those “glut” signals from the past, yet oil prices aren’t tanking.
A Real Trigger: OPEC’s November 2014 Decision
In June 2014, Brent crude hovered around $115 and WTI near $107, with big banks still predicting steady prices. But by January 2015, oil had plunged more than 50%.
The Turning Point came on November 27, 2014, when OPEC—led by Saudi Arabia—chose not to cut production.
Ali Al-Naimi, Saudi’s oil minister, bluntly stated, “It is not in the interest of OPEC producers to cut their production.”
Suddenly, defending a high-priced floor was out, and maintaining market share was in.
With global demand already softening, that single decision supercharged the oversupply, fueling one of the sharpest crashes in recent memory.
Shale’s Sudden Flood & Cooling Demand
Around 2014, U.S. shale output soared from 5 to nearly 9 million barrels per day, thanks to fracking breakthroughs.
Many shale wells had breakevens around $60, so even $80 oil was plenty profitable. This undercut OPEC’s role as the global swing producer, adding barrels into a market that was already well-supplied.
Meanwhile, China’s growth cooled, Europe was flirting with deflation, and Japan slipped into recession.
With demand faltering, Bank of America and Citi soon warned oil could tumble below $50 if OPEC stood by.
Their warnings proved prophetic as the surplus swelled.
- The Result: A 50% Price Collapse in Six Months
Between that June peak and January 2015, both Brent and WTI lost more than half their value. The shift blindsided many.
In a Bloomberg interview right after the OPEC meeting, one hedge fund manager lamented, “We were all betting on a production cut; now we’ve got a tsunami of supply.”
U.S. shale firms scrambled to cut costs, lay down rigs, and renegotiate service contracts. OPEC members—particularly Venezuela and Nigeria—began feeling acute budget stress.
Saudi Arabia, armed with vast reserves, weathered the storm but stuck to its guns, aiming to test the profitability of higher-cost U.S. shale.
Doesn’t this all sound familiar?
What’s Changed? Stockpiles & OPEC Output Look Familiar—But Prices Aren’t Crashing
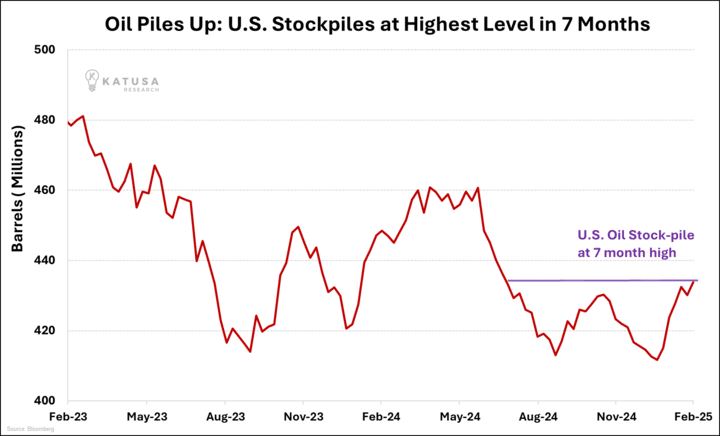
Today, the EIA shows U.S. crude inventories at 7-month highs, and OPEC’s output has hit a 13-month peak—both classic signals of oversupply.

In 2014, that combination spelled disaster. Yet now, oil isn’t nose-diving.
One factor could be refinery maintenance or short-term logistics inflating stockpiles.
Another is that OPEC might be more agile, ready to cut supply if prices wobble.
Others think demand might be weaker than official data suggests.
So while inventories are piling up, the response from producers—and the global economy—doesn’t match 2014’s no-holds-barred price war.
Conventional wisdom says rising inventories = oversupplied market = price drop. Indeed, in 2014, swelling U.S. stockpiles foreshadowed the crash.
OPEC’s Output Hits a 13-Month High—But Prices Don’t Collapse
The next chart shows OPEC crude production side by side with WTI prices.
OPEC’s output just reached its highest level in over a year, normally enough to send bulls running for the exits. Yet the market hasn’t crumbled.
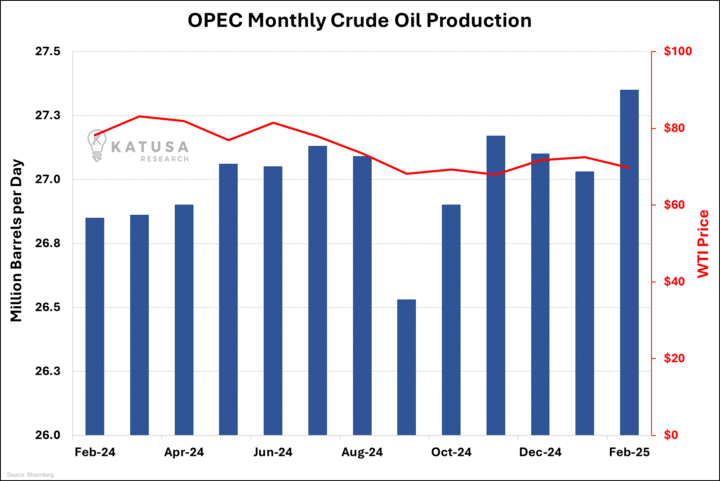
OPEC’s output climbing should, in theory, hammer prices. But it hasn’t.
Unlike 2014, OPEC has shown willingness to cut production quickly if prices dip too low.
Saudi Arabia especially no longer wants an all-out price war—they’re more flexible now.
Global Oil Demand Forecast: Higher Than You Think
One more wildcard is global demand.
Even if supply is rising, the third chart could show the International Energy Agency (IEA) or EIA projecting an uptick in overall oil consumption, especially in emerging economies.
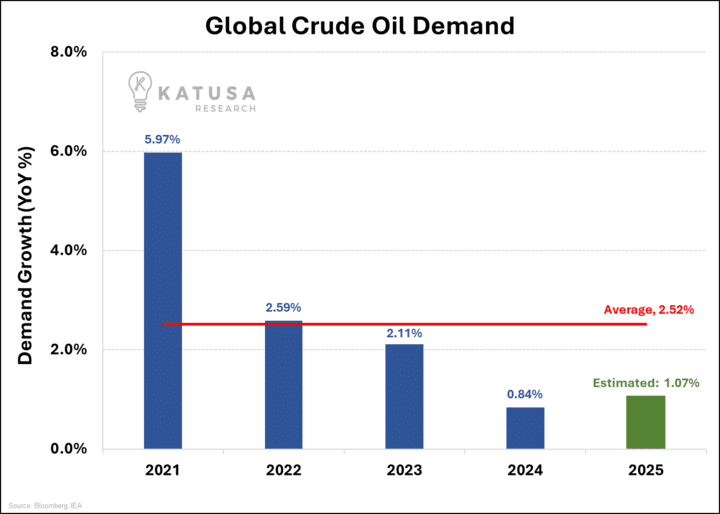
If global demand outpaces current supply estimates, today’s apparent glut could vanish overnight—and send prices surging.
The big question: Will that demand surge arrive in time to soak up the extra supply?
Is Oil on its Way Down: A Flashback to 2014—or Something Else Entirely?
Back in 2014, a flood of U.S. shale and a hands-off OPEC strategy led to a historic price crash.
Fast-forward to 2025, and we’re once again seeing rising output, ballooning inventories, and shaky global economic signals.
History might suggest a replay—but the differences are striking:
- OPEC’s Flexibility: Today’s OPEC seems more willing to cut production if prices slip too far.
- Geopolitical Tensions: Sanctions on Russia, Middle East uncertainties, and shipping routes at risk can snap supply tight at a moment’s notice.
- Post-Pandemic Demand: Many countries are still ramping up their industries and travel sectors, potentially absorbing more oil than anticipated.
Don’t Sleep on the Possibility of Whipsaw Action
If U.S. stockpiles keep climbing and OPEC production stays high, we could see a near-term downturn.
But if a single catalyst—like a sudden OPEC cut, a jump in Chinese imports, or geopolitical disruption—hits, the market could whipsaw in the other direction, just as we’ve seen in past cycles.
I’m keeping a hit list of oil stocks I’d love to buy if a panic or capitulation strikes again.
Because when these signals align, bargains can surface faster than the crowd can react.
In 2014, the market was blindsided by a wave of new supply.
Today, we’re seeing similar warning lights—but the background music is different.
With OPEC’s agility, recovering global demand, and ongoing geopolitical twists, the next move might catch even seasoned traders by surprise—just like last time.
And I’m going shopping if panic hits.
Regards,
Marin Katusa
You might like…

Details and Disclosures
Investing can have large potential rewards, but it can also have large potential risks. You must be aware of the risks and be willing to accept them in order to invest in financial instruments, including stocks, options, and futures. Katusa Research makes every best effort in adhering to publishing exemptions and securities laws. By reading this, you agree to all of the following: You understand this to be an expression of opinions and NOT professional advice. You are solely responsible for the use of any content and hold Katusa Research, and all partners, members, and affiliates harmless in any event or claim. If you purchase anything through a link in this email, you should assume that we have an affiliate relationship with the company providing the product or service that you purchase, and that we will be paid in some way. We recommend that you do your own independent research before purchasing anything.
