In this week’s Katusa’s Investment Insights…
|
Few investors know about “The Silver Trade of 1980″…
Perhaps the most brilliant wealth transfer in precious metals history.
When silver hit its peak of $50/oz in 1980, the gold-to-silver ratio plummeted to a historic low of 17:1.
That means it took just 17 ounces of silver to buy a single ounce of gold.
The few investors who traded silver for gold at that ratio watched their holdings multiply when the ratio snapped back.
Today, we stand at the opposite extreme – a level that has only appeared twice in the past 25 years.
Each time, it signaled silver’s explosive outperformance was imminent.
The data I’m about to share shows silver is nearing another turning point—one that could match today’s best opportunities.
The most reliable signal in silver’s history has just appeared again.
Silver’s 100 to 1 Activation Point Just Triggered
- In precious metals markets, an ‘activation point’ occurs when a specific technical level is reached—like history repeating itself with surprising accuracy.
The gold-to-silver ratio just hit 100:1, meaning one ounce of gold buys 100 ounces of silver.
Again, this extreme imbalance has only happened twice in the past 25 years.
What followed each time was that silver outperformed gold by 3-5x during the subsequent precious metals’ rallies.
In 2010, when this ratio last peaked near 70:1, silver jumped from $15 to $48 in just 14 months—a 223% surge while gold gained 45%.
After the 2020 spike to 124:1, silver doubled while gold gained just 31%.

Silver is both a monetary metal like gold and an industrial metal critical to solar panels, EVs, and electronics.
Big investors keep buying gold but still overlook silver. That gap sets silver up for larger gains as the metals rally builds.
Silver’s Stealth Bull Market: Smart Money Moves First
The next chart exposes a critical pattern most investors are completely missing in the silver market.
While silver prices (gray line) have climbed from $20 to $30 over the past year, ETF fund flows tell the real story.
Look at late 2023 through early 2024.
As silver began its upward move, we saw massive green spikes of money flowing into silver ETFs…
With over $700 million of net fund flow in the second half of 2024.

But here’s what’s fascinating: Despite silver recently hitting new multi-year highs around $30, the latest fund flows show persistent outflows (red bars).
This isn’t bearish – it’s wildly bullish. The smart money is bypassing paper ETFs and securing physical silver directly.
The identical pattern emerged in gold months ago before its explosive move above $3,000. First came ETF buying, then physical accumulation as sophisticated investors recognized the supply shortage.
Silver stockpiles are thin, and the ratio sits at 100:1. History shows these conditions often come right before silver’s biggest jumps.
The public hasn’t even started buying silver yet – that’s still coming.
Central Banks and Silver Holdings
So, do central banks hoard silver like they do gold?
In short, no.
It’s neither stable nor valuable enough to hold in reserve. Silver also takes up far more vault space per dollar than gold, so it is an inefficient reserve metal.
But remember that’s advantageous for silver. Because its market cap is tiny compared to gold, other industries, or even large companies.
So, any marginal increase in silver buying or selling tends to send prices into a complete frenzy.
Scale is key for massive gains and here’s why…
The Silver Market’s Hidden Microverse
This single chart reveals something so profound it should make every investor stop and think.
The entire silver mining industry—the companies that produce one of history’s most important monetary and industrial metals is worth just $73 billion.
Let me show you how small the silver market is.
In 2023, $6.07B worth of silver produced went to investments in physical products or ETFs. That figure for gold was $62.7B.
The following chart compares the silver market to other major asset classes and large companies.
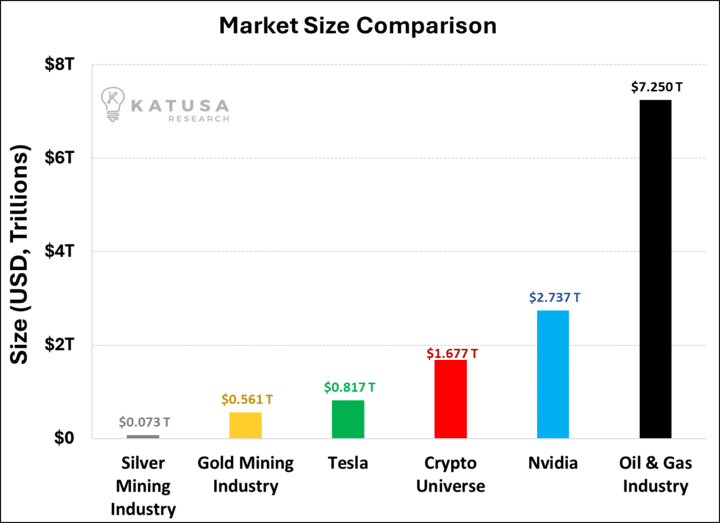
- As you can see, the entire silver market is a blip relative to these other sectors.
That’s why, when gold pops, silver tends to rise far, far more.
Let this sink in. The global silver mining sector is:
- 1/12 the size of the oil & gas industry
- 1/4 the size of Tesla alone
- 1/10 the size of Nvidia
- 1/5 the size of Bitcoin and other cryptocurrencies
Even the gold mining industry, itself tremendously undervalued, dwarfs silver miners by 4.98x.
This microscopic market cap means even modest capital inflows create explosive price movements.
- If just 1% of the money in oil & gas shifted to silver miners, it would triple the entire silver sector’s value overnight.
When silver begins its historical outperformance of gold at the 100:1 ratio, these miners typically deliver 5-7x the gains of the metal itself.
During the 2010-2011 silver run, top miners returned 400-600% while silver gained 150%.
The Silver Opportunity Ahead
The smallest boat rises fastest in a rising tide. And silver miners represent the smallest vessel in the financial ocean, perfectly positioned for the incoming wave.
History suggests we’re at the beginning of a significant move—not the end, so here’s what I’m doing personally:
- Building watchlists of select silver miners with proven reserves and low production costs.
- Maintaining some dry powder for additional opportunities as this silver cycle accelerates.
- Focusing on companies with leverage to silver prices but strong enough balance sheets to weather volatility.
Remember that timing the exact bottom is impossible, but positioning before the broader market recognizes this opportunity is essential. And I’m positioning myself to do just that…
You can see what I’m doing in my premium research service – Katusa’s Resource Opportunities.
Congratulations to all subscribers reading this, where our latest pick is up over 45% in just the past three weeks.
Regards,
Marin Katusa
Details and Disclosures
Investing can have large potential rewards, but it can also have large potential risks. You must be aware of the risks and be willing to accept them in order to invest in financial instruments, including stocks, options, and futures. Katusa Research makes every best effort in adhering to publishing exemptions and securities laws. By reading this, you agree to all of the following: You understand this to be an expression of opinions and NOT professional advice. You are solely responsible for the use of any content and hold Katusa Research, and all partners, members, and affiliates harmless in any event or claim. If you purchase anything through a link in this email, you should assume that we have an affiliate relationship with the company providing the product or service that you purchase, and that we will be paid in some way. We recommend that you do your own independent research before purchasing anything.
