Earlier this year I highlighted that it was about to get spicy in the copper market.
There were several signals that were flashing that made me pay attention.
For example…
- Inventories were declining,
- The EV mania was in full force,
- Economies were starting to reopen
It was only a matter of time before generalist investors connected the dots.
And now the mainstream investor, along with the Reddit/TikTok/Twitter finance gurus are making the case for moonshots.
But the actual substance to the sizzle is this…
The World Needs a Lot of Copper
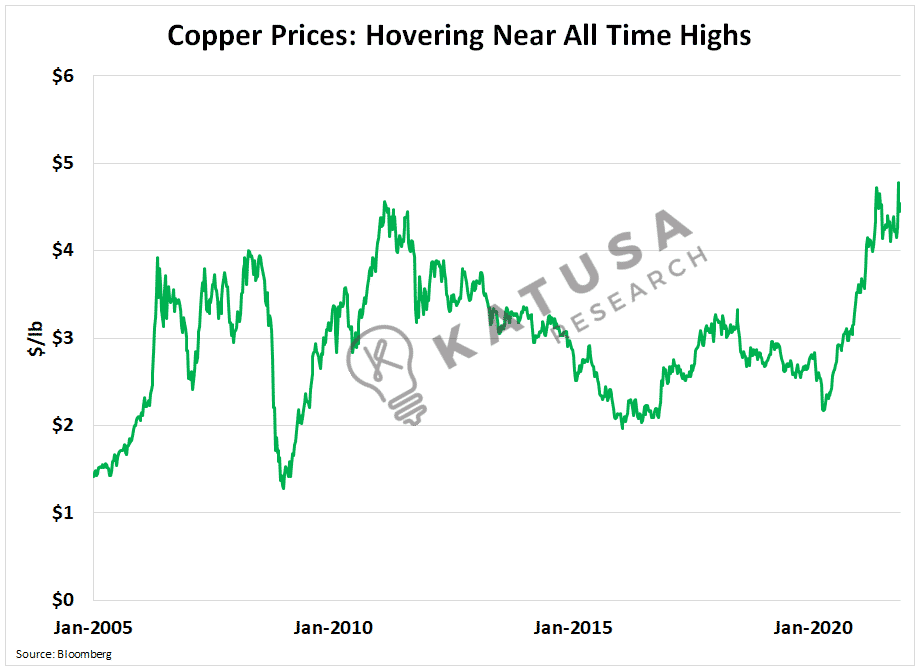
Today, copper and copper producers are up over 30% on the year, recently taking out all-time highs set back in 2011.

Much to the irritation of the gold and silver bugs who have had a tough year and waiting for their day in the sun…
Copper producers have done very well this year.

Copper 101
Copper is a key input into construction and infrastructure projects, power lines, appliances, and vehicles.
- So, as you might expect there is a positive relationship between copper demand and macroeconomic growth. This is why it is affectionately known as Dr. Copper.
Below is a chart which breaks down copper demand by end-user.

Economies are reopening, infrastructure investments are being made, and citizens are doing their best to get back to some form of normalcy.
Ultra-low interest rates and highly accommodative central bank policies have incentivized enormous amounts of capital to be put to work.
Copper Supply and Demand 101
Previously I highlighted the world’s ability to warehouse less copper, which I believe is part of the general decline in inventories.
The Amazon “just in time” delivery approach is a cost saver to producers and downstream manufactures, so it works when the economy is fully efficient.
But right now, due to the pandemic, it’s not.
- We’ve all seen the pictures on the internet of bare aisles in grocery stores or hardware stores…the same thing is happening in the copper market.
As a result, demand is beginning to outstrip available supply and inventories are falling in a big way.
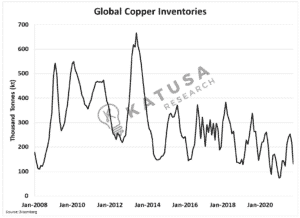
Shown below is the total amount of copper held in inventories at major exchanges around the world.

The general decline is obvious. But the steep drop this year is considerable, as supply chain bottlenecks have made it challenging for manufactures to get supply.
- This has led to a heavy collapse in copper inventories most notably in London where we’ve seen inventory levels decline by over 40% since mid-September.

Get to Know the Copper “Cash” Contract
Copper for immediate delivery, known as the “cash” contract is at its all-time high relative to copper contracts for future delivery.
The difference between the 2 contracts is known as the “spread”.
In the copper world, the most referenced spread is the cash contract to 3-month delivery. This compares the price of copper today, to the price of copper 3 months from now.
- When short-term copper demand is very high, prices for copper today will be higher than prices for copper tomorrow.
Right now, this spread is at an all-time high…

Elon, Electrify Me
What the world is finally beginning to understand is that copper is directly linked to electrification.
Electric vehicles, charging stations, wind turbines, and new transmission lines, all need copper and lots of it.
For example, an electric vehicle needs over 150 pounds of copper.
Conventional power production requires approximately 2,204 pounds of copper per megawatt.
So what about renewables? Glad you asked…
- Renewable technologies require 8000+ pounds of copper per megawatt.
As the world goes towards net zero, ESG and “greener”. It will require a LOT more copper out of the earth.

We’re Still Early to The Copper Story
And the runway is growing longer…
Last Friday, US lawmakers passed an infrastructure spending bill totaling $550 billion.
- Fiscal stimulus packages globally are estimated to be trillions of dollars over the coming decade.
So it’s safe to assume that Doctor Copper should be a beneficiary, including copper stocks (which have been on a tear the past 12 months).
One of the copper companies featured in my premium research service exploded out of the gates from $1.40 all the way up past $14.50 this summer.
That’s a 936% profit for people that bought shares at $1.40 in the first days of trading.
But for subscribers to Katusa’s Resource Opportunities, the effective gain was A LOT HIGHER…
For subscribers that participated in a special deal I published on, the effective cost basis for these shares was 50 cents.
That’s a 2,800% return:
Skate Where the Puck (and MONEY) is Going…
Right now, my team is laser-focused on the decarbonization theme.
Renewable energy, electric vehicles, and carbon offsets all play major roles.
I believe governments around the world are going to tax the high polluters and use that cash to subsidize the switch to greener economies.
In next month’s premium report to subscribers of Katusa’s Resource Opportunities…
For the first time ever, I will release a mega list of companies and the calculated impacts of carbon taxes on each company.
This granular assessment allows us to look for big winners and avoid overnight balance sheet destruction and massive impairment charges of some well-known names.
If you want the list along with all my top investment ideas and research, click here to learn how to become a subscriber.
Regards,
Marin


