All it took was a hint.US Fed Chair Jerome Powell spoke that rates may be topping out and then gold prices took off late Wednesday, making a new all-time high of $2,085 per ounce.
Record Highs for Gold: Technical Analysis
Momentum buying popped stop losses that were set at previous highs which triggered a quick covering frenzy and pushed gold prices upwards.Gold has held its short-term support above $1750 and has pushed through past highs which are key resistance points.

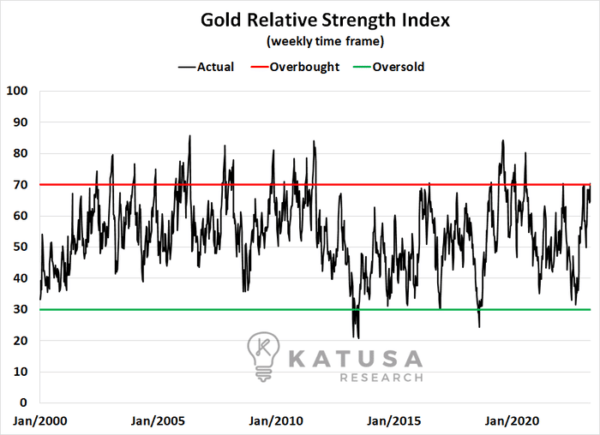
Examining the Relative Strength Index for gold, you can see that we are approaching an overbought level. This makes sense given the quick move up to new highs.
However, just because an indicator says gold is overbought, doesn’t mean gold can’t go higher. Momentum is nearly impossible to gauge correctly.We can see how multiple times; gold broke well above the “overbought” level for its RSI. The same can be said on the downside.
- I have said it before, in order for gold to truly be in a bull market, we need to see multiple consecutive weekly closes above this $2085 area.
This would represent the creation of new support points above previous highs which would be bullish for gold.As I outlined recently to my premium members, generalist investors aren’t investing heavily in gold or gold stocks right now. However, this could change rapidly as new all-time highs come into play.
What will it take for record highs in copper?
I consider myself fortunate to have been involved in every stage of a copper mine.Everything from exploration, to financing an IPO, to permits and development to production.While I’ve discussed this experience before, I’ve gained a wealth of knowledge that most analysts are not aware of when analyzing a mine: Including start-up, exploration, permitting, financing, construction, and operation risks and challenges.This is because the actual operations of a mine are challenging and present numerous problems and obstacles that analysts rarely encounter.As an investor in commodities at all lifecycles, you have to know Murphy’s Mining Law…
- Everything and anything that can go wrong will go wrong.
After 20 years of travelling the world to analyze resource projects, I’ve ended up in the cautious camp for my portfolio and prefer to stay in advanced assets within +SWAP Line Nations.And I’m always a proponent of the AK47 indicator.That is unless I can obtain free upside through positive asymmetry (high reward for the high risk).The SWAP Line Nation concept continues playing out since we brought it to the forefront back in 2020. (You can learn about what a positive or negative SWAP line is right here.)Here’s an example…Most recently, mining giant First Quantum has threatened to shut down the very large Cobre Panama mine.This is a mine I happen to know very well…Back when I first uncovered this asset, it was called Petaquilla. I first visited the Petaquilla copper project in 2006 and then organized a financing for my subscribers in early 2007.A little-known fact: That mine also almost became combined with another project I was involved with as a director that was put into production. The twists and turns in the boardrooms of producers is never boring.Inmet bought out Petaquilla Copper in 2008 and then First Quantum bought out Inmet and renamed the mine to Cobre Panama from Petaquilla. Safe to say, my subscribers and I did very well on the Petaquilla financing in 2007.But here is the thing, pre-Great Financial Crisis in 2008, it was a very different market…It was a bull market for resources, where China’s economy was booming and it couldn’t produce nearly enough copper or other base metals domestically to satisfy its internal demands.This meant the Chinese had to be very aggressive in acquiring copper and other industrial metals from overseas players.I was nowhere near as experienced in copper back then as today. I was young, aggressive, and took positions without understanding the full array of risks. I did not truly understand the magnitude of the risks at the time.
Politics and Profits
In another example, Chile just made a major announcement with the goal to nationalize its lithium sector. This sent stocks in a tailspin and put copper companies in the region on notice.It all means one thing…Across the board (especially in emerging market nations) Governments will want a higher cut of the profits. And the owners of the mine (most likely a foreign company listed on the US, Canadian or Australian exchange) will fight back.Who wins in this case?
- The lawyers? Yes.
- The politicians? Yes.
- The consultants? Yes.
- The shareholders? No.
Going back to the First Quantum example, I believe the company will eventually have to pay more to the government of Panama in some capacity from the revenue of the metals generated from the mine. And I can almost guarantee the shareholders will always lose in this scenario.Before you go into just any jurisdiction, do your homework:
- The odds of making an exploration project into an operating mine are roughly 1 in 3000.
Few mines pay shareholders an amount from the free cash flow to warrant the risk one takes by investing in the operation.
Gold vs Copper: Profit Check
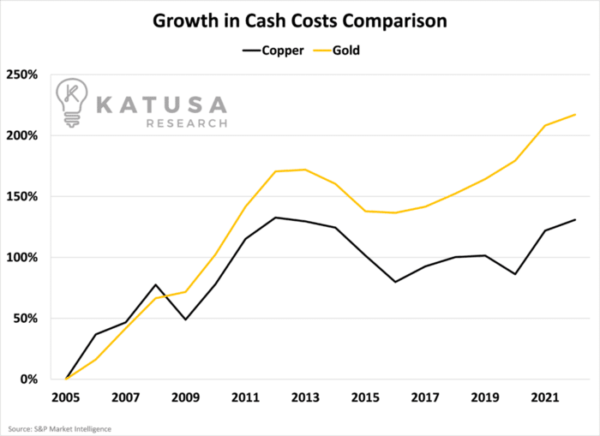
All of my subscribers know I’m a big fan of cash-flowing companies.Another recent analysis we did was to put the copper market against the gold market and make some cash flow and cost comparisons.The numbers were fascinating…You might think that miners would all have similar growth in costs and profit margins but that is not the case.Since 2005, cash costs for gold producers have increased by over 200%, whereas copper producer cash costs have only increased by 130%.The chart below shows this step change in costs over the years.
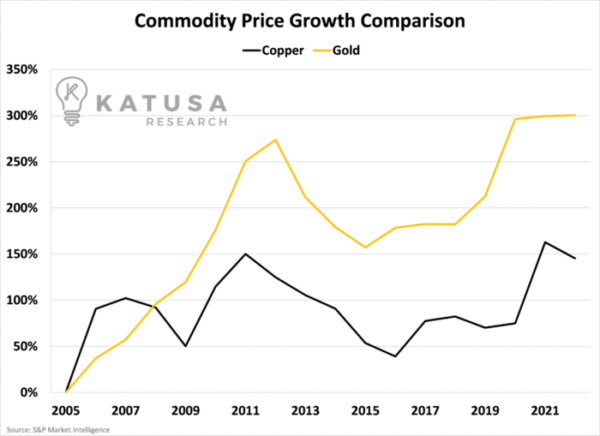
Now that’s only one side of the coin. The selling price of the commodity is important to consider as well. If metal prices rise faster than costs, margins would improve and the producer would be better off.The chart below shows the appreciation in prices for gold and copper.
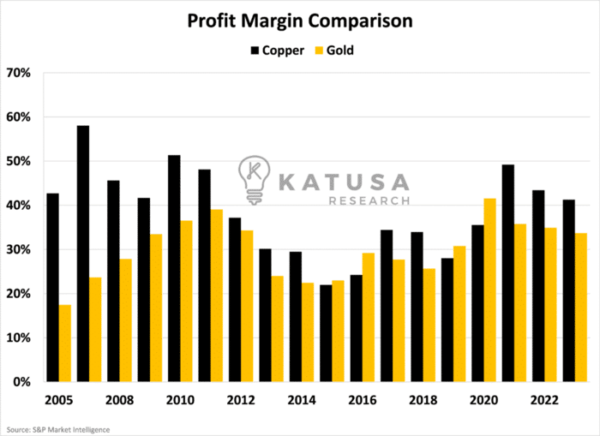
So, as you can see, gold prices have risen faster than copper prices, which negates the cash cost inflation.Finally, we can compare the all-in costs relative to the selling price through a profitability margin metric.This margin is calculated using the difference between the selling price of the commodity and the all-in-sustaining cost.

The chart below plots this metric for each year from 2005 through 2023.
Interestingly, copper profit margins have typically outpaced those of gold miners.Now, these are sector averages so there will be companies on both sides of that average, but it is an interesting data point that many investors likely didn’t know.Moving forward, profit margins for copper and gold are healthy, but it is possible we see some compression through inflationary impacts on production costs.This is a glimpse of the data we take into account before buying shares in a company.If you want the heavy lifting done for you, click here to learn more about my premium research.Regards,Marin Katusa
Details and Disclosures
Investing can have large potential rewards, but it can also have large potential risks. You must be aware of the risks and be willing to accept them in order to invest in financial instruments, including stocks, options, and futures. Katusa Research makes every best effort in adhering to publishing exemptions and securities laws. By reading this, you agree to all of the following: You understand this to be an expression of opinions and NOT professional advice. You are solely responsible for the use of any content and hold Katusa Research, and all partners, members, and affiliates harmless in any event or claim. If you purchase anything through a link in this email, you should assume that we have an affiliate relationship with the company providing the product or service that you purchase, and that we will be paid in some way. We recommend that you do your own independent research before purchasing anything.


