
No investors paid it any attention…Central banks around the world just made a monumental statement, purchasing a record amount of gold this past quarter.
- Central banks purchased 400 tons of gold in Q3 and brought total purchases YTD to 673 tons.
Purchases of that size haven’t been seen since 1967 and the largest this decade… with a final quarter yet to go.

And this does not include any reported purchases from two normally large gold buyers – Russia and China.
- Turkey, Russia, India, and China have the largest buyers of gold over the past 3 years, hoarding over 20 million ounces.
With gold up 5% the past week and holding above $1700, many gold stocks have seen sharp double-digit gains.Let’s look if the bottom is in…
The Big Fed Question
Given the transparent guidance from the US Federal Reserve, it is almost certain that interest rates will move higher.Higher interest rates in developed nations like the United States, traditionally strengthen a nation’s currency.Because foreigners will swap their local currency for dollars to earn higher interest rates.
- A strong dollar is a headwind for gold priced in US dollars, and a tailwind for gold priced in your local market.
Again, based off the Fed’s guidance, I believe rates will stay elevated for some time…
- This puts a headwind on gold priced in US dollars over the next 6-24 months.
This could be why foreign central banks are purchasing gold in record numbers.Now, this could all change overnight if there is a 180-degree shift in economic policy.But I don’t see the U.S. Fed doing a pivot by year-end.However, even with all the negativity surrounding it, gold emerged as a good investment on relative terms.The chart below shows the year-to-date total returns for major asset classes.
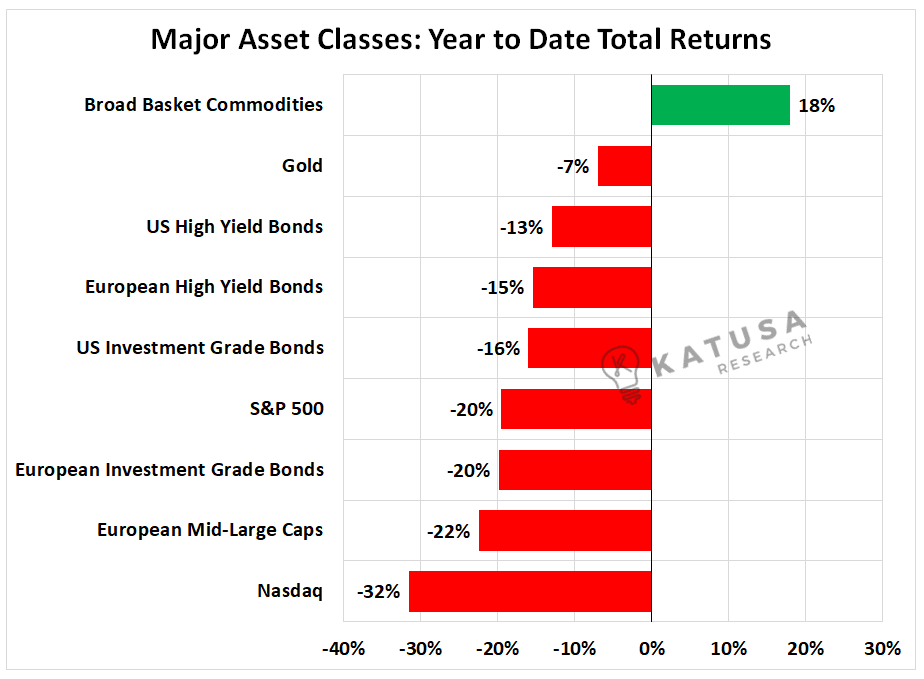
Outside of the commodities basket (which in large part is up due to oil), gold has held in well relative to other asset classes which are down considerably more.Gold denominated in foreign currencies has proved to be a safe bet and is up YTD in many currencies.But to confirm…
- A true bull market in gold is only in full swing when the price of gold is going up in all currencies, including the US Dollar.

The Ultimate Precious Metals Bottom Indicator?
Gold producers have fared far worse than the bullion, on average gold producers are down 25% or more year to date.One of my sector health gauges for precious metals is looking at cash as a percentage of market capitalization.This measures the percentage of the company’s value backed by cash, relative to the amount of value the market is placing on the company’s assets.
- When times are good – Cash will be a very small portion of the company’s valuation.
- When times are bad – Cash will make up a higher percentage of a company’s valuation.
As you can see in the chart below, the ratio has crept up and recently surpassed the recent 2018 high. This means that on average more than 12.5% of the sector’s valuation is backed by cash. For comparison in December 2019, roughly 5% of the sector was backed by cash.

The Gold Bargain Bin
Share prices for gold miners have declined but valuations are still not at bargain-bin levels.The chart below shows the price-to-cash flow estimate for next year for a group of large gold producers.

You can see the sample is now trading below its 10-year average.This is a good sign for value investors, but what we are looking for is a move below 5.0x, which we believe will arrive.
- Under 4.0x would represent the most undervalued gold producers would be over the past decade.
I believe we will continue to see trading multiples compress further as cash flow forecasts are readjusted lower.Even if I miss the bottoms, we track the financials close enough that we will catch the uptrend if it starts taking off.I am not confident enough to try and call a bottom.And I think with the headwinds we see ahead, we are confident we have time to slowly build our positions using our tranche methodology.
Bonus Bottom Indicator Chart…
- One of the key drivers in revised cash flow forecasts will be because of higher operational costs…
After managing to keep costs in line from 2014-2020, a rising gold price coupled with inflation paved the way for a large spike in operational costs.

The chart above shows cash costs vaulting higher over the last 2 years.On a mine-by-mine basis, it’s possible to reduce operational costs by improving efficiencies.But as you can see in the chart, it’s rare for the whole sector to be able to claw back a substantial portion of any large increase in production costs.What does this mean?It means that these new elevated costs of production for the most part are here to stay.
Parting Thoughts for This Week…
I don’t know when the exact bottom will be, and I never try to catch a falling knife.Once the rug gets pulled and the final capitulation happens (and I suspect we’re close)…I’ll be ready to jump on the best companies like an alligator.
- The central bank gold buying activity…
- The precious metals company valuations at multi-year lows…
- Corporate cash levels at multi-year highs…
All the indicators are signaling a warning and that we’re getting to the good part.These are the types of bargains I live for.Subscribers to my premium research service – Katusa’s Resource Opportunities – will see exactly where I’m putting my money in this bear market.And when I’ll be pulling the trigger to own companies on my radar.There are amazing deals to be had, but fortune only favors the bold and well-prepared.Uranium, Carbon, and precious metals are all shaping up to be very important sectors over the coming years.These are times to batten down the hatches, make an alligator plan and prepare for the time to strike.Regards,Marin Katusa
Details and Disclosures
Investing can have large potential rewards, but it can also have large potential risks. You must be aware of the risks and be willing to accept them in order to invest in financial instruments, including stocks, options, and futures. Katusa Research makes every best effort in adhering to publishing exemptions and securities laws.
By reading this, you agree to all of the following: You understand this to be an expression of opinions and NOT professional advice. You are solely responsible for the use of any content and hold Katusa Research, and all partners, members, and affiliates harmless in any event or claim.
If you purchase anything through a link in this email, you should assume that we have an affiliate relationship with the company providing the product or service that you purchase, and that we will be paid in some way. We recommend that you do your own independent research before purchasing anything.
