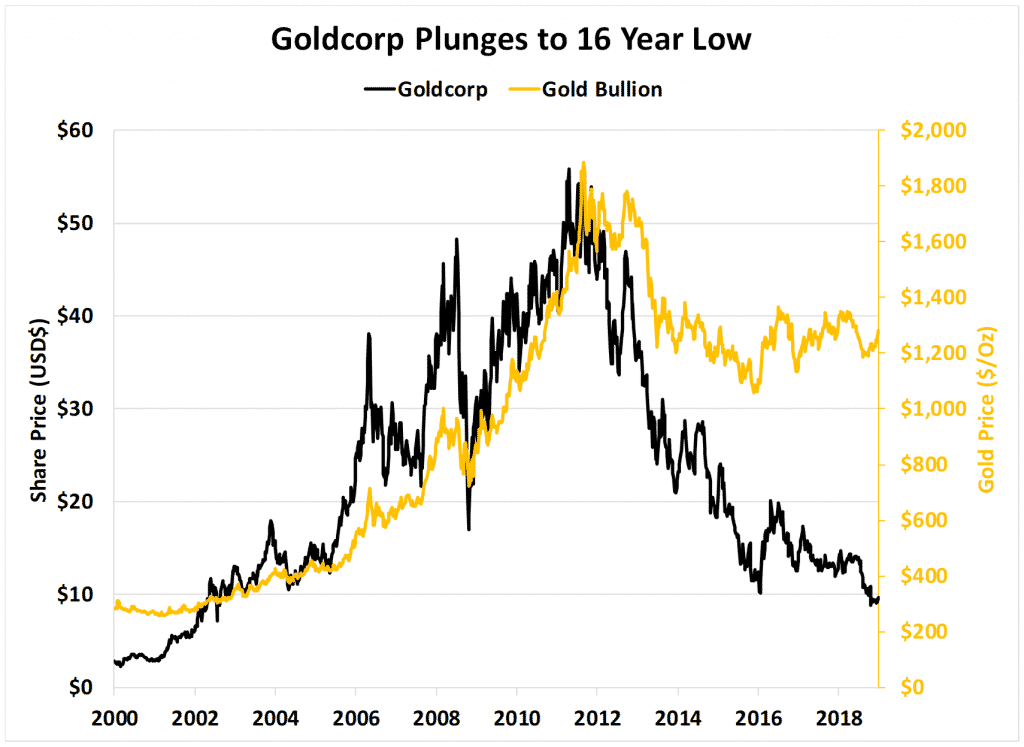
Back in October 2018, Goldcorp was trading at its lowest level in 16 years.

Goldcorp wasn’t alone. Shares of precious metal mining companies were decimated in a horrid year for gold stocks.
The last time Goldcorp traded below $9 was in 2002. That was back when gold was trading for under $300 an ounce.
Magical Time of the Year
We’re now entering the alligator investor’s favorite season. It’s one where a government law allows us to pick up shares on the cheap.
These are shares of companies that are the good, the bad & the ugly and everything in-between.
This phenomenon happens like clockwork every year, like a washer’s rinse and repeat cycle.
Tax Loss Selling Bargain Season Has Begun
When a large volume of sellers head for the exits, you want to pay attention. Investors selling in panic is a great way to find cheap prices for great stocks.
Christmas often comes early for small-cap investors.
And that means opportunities to make hundreds of thousands – even millions – of dollars in extra profit.
Here’s what happens…
At the end of the year, investors and speculators start looking at their portfolios and formulate plans to reduce their tax bills.
This means deciding if positions should be held to get short-term gain tax treatment or long-term gain tax treatment.
But more often than not, it means deciding to sell stocks based on factors that have little to do with their underlying values.
If you’ve read my work for a while, those words should trigger your interest. You know that most of the time, the market places the correct value on assets. But not all the time.
As investors, we find our edge during those rare times when buying and selling decisions are not made based on values, dividends, or cash flows. But instead, on external factors like fund redemptions, tax considerations, or fear the world is about to end.
These periods are one of the only times that intrinsic value seriously decouples from share prices.
In other words, when selling decisions are based on factors that have little to do with underlying values, we – the patient alligators – can strike and pick up assets for bargain prices.
This is exactly what happens at the end of a brutal resource year like the one in 2018 in the resource market.
Investors dump stocks simply to lock in losses or gains because their upcoming tax bill is first and foremost in their minds.
Tax Loss Season in North America’s Most Speculative Market
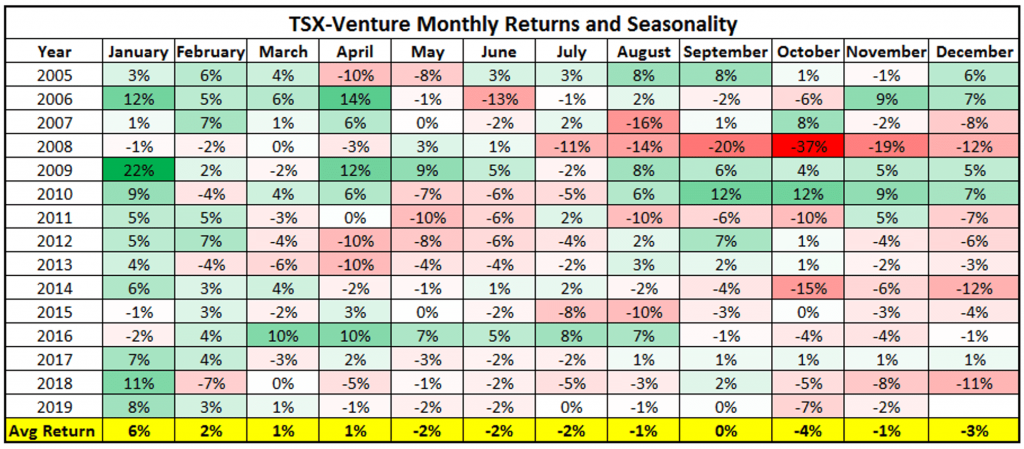
The next 4 weeks are called “tax loss season” in the global markets. Below is a table which shows the monthly returns of the TSX Venture exchange. November and December are ugly times for the speculative investor.


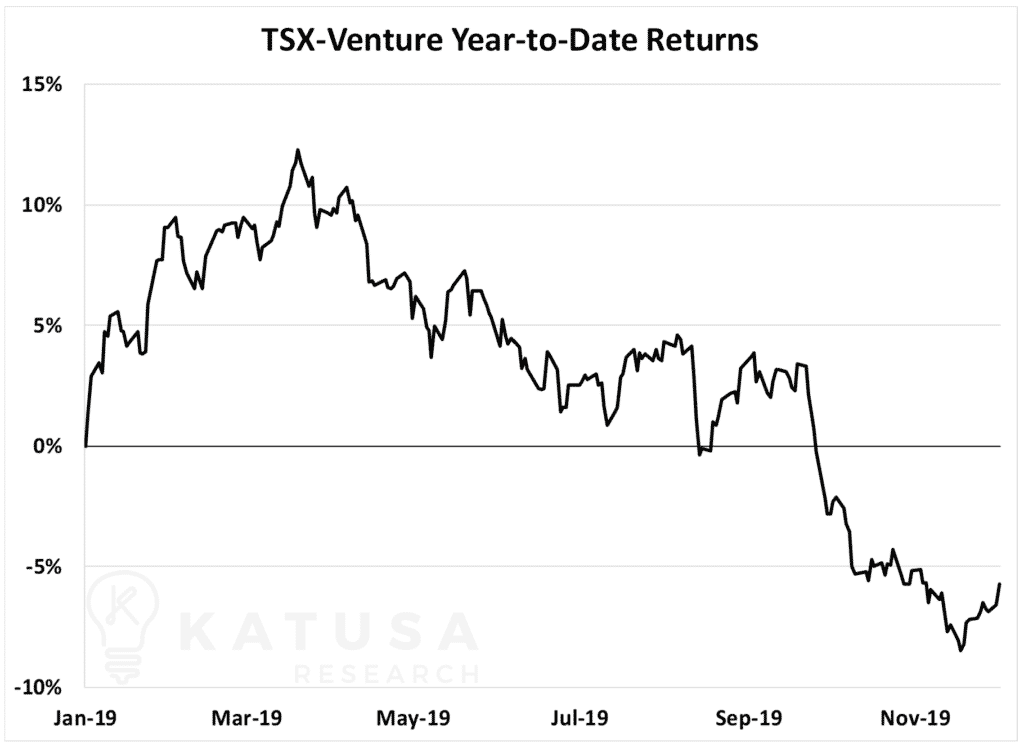
Leading the cascade lower in 2019 are the cannabis companies, down on average 30-40% for the year. Right behind them are the oil and gas producers, both in the United States and Canada. Many oil and gas producers are down 20% to 40% on the year.
Like a bug under the foot of King Kong, I believe certain companies will get squashed with further selling.
That means lower share prices.
Losses in cannabis, energy stocks (oil & gas) and even mining could spell an ugly tax loss season.
While tax loss selling can occur at any time of the year, there is a window where it really kicks into high gear. This is the time where investors crunch the numbers on their wins and losses for the year, and how much taxes they have to pay.
In addition, fund managers start to window dress, which means selling their losers and pushing the winners higher.
Number Crunching and Solving the Broken Clock
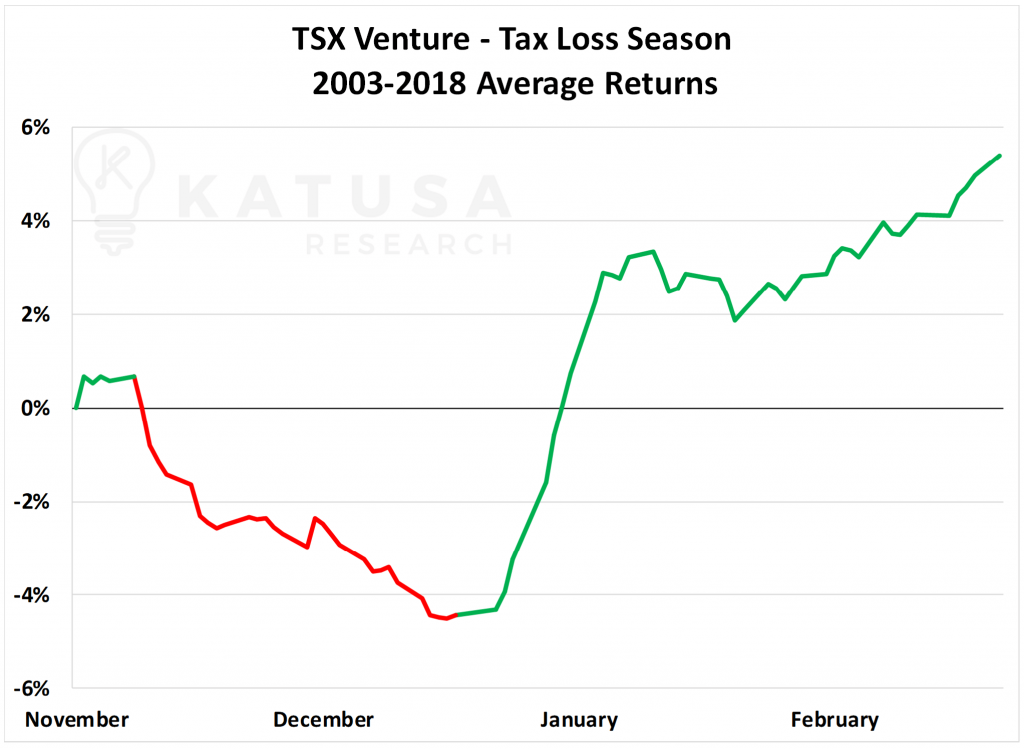
We did an in-depth analysis of the past 15 years of tax-loss seasons on the TSX Venture exchange to get key info.
In the chart below, we’ve overlaid several years of the TSX Venture exchange during a specific time period. You can see a clear pattern…

And then a “panic rally” commences during the first 60 days of the year. This happens as sold off – yet intrinsically strong – companies explode higher.
A Tax Loss Fire Sale Could Set up Red Hot Gains for 2020
Last year we waited patiently to purchase 3 companies below what they were trading at. And that patience paid off as subscribers joined me in making some big gains…
Two of our buy targets were filled out of the 3 we issued. One company we bought is one of the world’s largest and best run silver companies – Pan American Silver – for a 73% gain.
The second company was Sun Metals, where we got filled under 22 cents. The stock caught fire early in the year rising 295% all the way to 65 cents at its peak.
My team and I have spent months going over the best stocks in the resource markets that we want in our portfolio during the 2019 tax loss season. And I’m going to be buying these 3 companies hand over fist if they reach my target price.
In a few days, I’m going to release my full tax loss report and how to capitalize on the “Panic Rebound” that ensues.
Regards,
Marin Katusa


