
Many gurus (some of which are friends of mine) are using a Bitcoin Pricing Model that has received an incredible amount of attention globally.
Nothing makes me happier than the math guys getting attention – except, of course, when the math is wrong.
The model getting the markets all hot and horny is called the “Stock-to-Flow Cross Asset Model”, or S2FX for short.
The author (who remains anonymous) says that this model can accurately price not just assets like Bitcoin, but also things like gold and silver.
If that sentence above hasn’t gotten alarm bells ringing in your head yet, it should.
Why do I say this?
Because the Stock-to-Flow model isn’t new. Mr. Anonymous’ model, as presented by Bitcoin gurus, is being talked about as if it’s as compelling as Einstein’s Theory of Relativity. Which, by the way, has nothing to do with light, and with that we can shed some light on S2FX.
The truth is, the Stock-to-Flow ratio has already existed for decades, used as an indicator in commodities markets.
But Let’s First Explain What Stock-to-Flow is First…
As the name suggests, the Stock-to-Flow (SF) ratio simply is:

Simply put, the SF ratio is a measure of how much of something there is to go around. Before Bitcoin came along, this ratio had already been used before for commodities like gold and silver, corn and wheat. And long-time Katusa subscribers will find this metric a familiar one…
After all, it’s more or less the same thing as my Days of Supply indicator that I use when I’m analyzing commodities like copper (see Charts to Watch #3 in this previous article, for instance).
So again, the first thing you need to know is that the basic concept of “Stock-to-Flow” isn’t some revolutionary new idea. It’s been around for decades.
However, what the author of the S2FX model does that is new, is create a mathematical model that he states can “[enable] valuation of different assets like silver, gold and BTC with one formula.”
Oh really?
We know that the SF ratio has already been around for decades. But many in the Bitcoin world think this is a breakthrough new model that’s just been developed.
As Trump would say, “Wrong.”
Alright, with that set up – class, let’s get started…
The author of this S2FX model calls it a “cross asset” model. That means it doesn’t just work for Bitcoin, but also gold and silver, and other assets.
The SF ratio had already been applied to gold and silver long before Bitcoin existed, and yet nobody came up with a similar model. So, was this overlooked, or is this a clue that something ain’t quite right with the model?
Another clue should be the fact that the author of S2FX has chosen to stay anonymous. Granted, some will argue that he isn’t anonymous to a select few in the Bitcoin world, but why not go public?
The author of S2FX is not using any inside information, no proprietary information, and nothing offensive or illegal, so this is quite odd. Perhaps our Anonymous Analyst was a fan of the rock band Kiss. And figured that since Kiss got way more attention with makeup on and staying anonymous, the same would be true for his work.
And just in case you were wondering, my favourite Kiss member was Ace Frehley. Ace has the best laugh in Rock’n’Roll.
But back to math, and back to S2FX…
If the S2FX model is as good as suggested, then the potential for massive profits is staggering. So it’s got my attention for sure.
What the Godfather of Card Counting Can Teach You…
When I think of revolutionaries in the world of making money, I think of men like Edward Thorp, pictured below. He is a cool dude, and I highly recommend his book “A Man For All Markets” – and the Foreword by Nassim Nicholas Taleb is great also.

Mr. Thorp is known as the father of card counting. A professor of mathematics who worked at MIT, he came up with various strategies to improve the odds of winning at Blackjack. But Thorp didn’t just talk the talk, he walked the walk. Mr.Thorp is the Elvis of math geeks.
He wrote a book in 1966, Beat the Dealer, outlining the very techniques he put to the test by – you guessed it – visiting casinos and winning money in Las Vegas. So much money, in fact, that he had to wear disguises like wraparound glasses and false beards.
Men like Thorp don’t just come up with theories. They put their money where their mouth is, and they’re not afraid to stand behind their ideas.
That’s the model I try to emulate myself with my publication, Katusa’s Resource Opportunities. I don’t just talk theory, I put it into practice. I got to where I am today by following my own rules – rules I put my name on – as I have a lot of skin in the game on anything I recommend.
One thing I can guarantee is that our Anonymous Analyst, who published the S2FX model, is no Edward Thorp or his ilk. I’ll explain why shortly.
Now, like I said last week, I’m not a Bitcoin hater.
I think it has an important role to play in our future. And all I’m trying to do with this report is bring a higher standard to the industry just like I did with mining.
There’s a lot of misinformation in the world of investing – and that’s true whether you’re looking at Bitcoin, gold, or stocks. That’s why I want to address the S2FX model, to break it down to see if it has any substance behind it.
After all, it could very well be a revolutionary new pricing model overlooked for years by countless experts in their fields.
I may be a skeptic – but never let it be said that I don’t do my due diligence. Like President Ronald Reagan said, ‘Trust, but verify’.
So, with that said, it’s time to do our homework on S2FX.
Breaking Down the S2FX Model
From here on out, we’re going straight to the source. We’re going to show exactly what the author of the S2FX model has written in their paper first in blue boxes, with our explanation immediately following each section.
S2FX Model
First, I will describe the concept of phase transitions because it introduces a new way of thinking about BTC and S2F. It explains why S2FX model is important.
Second, I will describe S2FX model, how it works and what the results mean.
Phase Transitions
Phase transitions are an important perspective in understanding S2FX model. During phase transitions, things get totally different properties. Transitions are often discontinuous. Three examples of phase transitions are:
- Water
- US Dollar
- BTC
Water
The classic example of phase transitions is water. Water exists in four different phases (states): solid, liquid, gas, ionized. It is all water, but water has totally different properties in each phase.
US Dollar
Phase transitions are also present in finance. For example the US Dollar has transitioned from gold coin (One dollar = 371.25 grains of pure silver = 24 grains of gold), to paper backed by gold (“In gold coin payable to the bearer on demand”), to paper backed by nothing (“This note is legal tender for all debts, public and private”). Although we keep calling it Dollar, the Dollar has totally different properties in these three phases.
Katusa’s Comments
On Phase Transitions:
It’s true that investments can perform in discrete increments: a junior mining company “phase transitions” when it acquires an exploration asset.
It “phase transitions” again when it gets drill results, again when it establishes an initial resource estimate, again when it conducts a PEA, again when it finishes building a mine and starts producing.
But there are always outside “swans” that can to the price such as a large newsletter writer writing up the stock which moves the price, or alternatively selling the stock and taking the price down. So, such outside items must also be considered in the real-life situations.
In the industry, we don’t call these “phase transitions”; they’re just intermediate steps in a company or asset’s lifecycle.
S2FX Model
Same is true for BTC. Nic Carter and Hasu show in their 2018 study how BTC narratives changed over time [4].
These BTC narratives seem very continuous in the chart. However, if we combine the narratives with financial milestones (and later S2F and price data), they look very much like phases with more abrupt transitions:
“Proof of concept” -> after Bitcoin white paper [5]
“Payments” -> after USD parity (1BTC = $1)
“E-Gold” -> after 1st halving, almost gold parity (1BTC = 1 ounce of gold)
“Financial asset” -> after 2nd halving ($1B transactions per day milestone, legal clarity in Japan and Australia, futures markets at CME and Bakkt)
These three examples of phase transitions in water, US Dollar and BTC offer a new perspective on BTC and S2F. It is important to not only think in term of continuous time series but also in phases with abrupt transitions. In developing S2FX model, I see BTC in each phase as a new asset, with totally different properties. A logical next step is identifying and quantifying BTC phase transitions.
Katusa’s Comments
S2FX and BTC Phase Transitions:
Phase transitions can explain points where the intrinsic value of an investment significantly changes.
What they don’t do, however, is actually lend support to, or provide evidence for, the author’s mathematical model. You can say that phase changes cause prices to go up or down, but without any math behind it, you can’t say by how much.
Let’s take the case of the Lundin Mining chart for example…
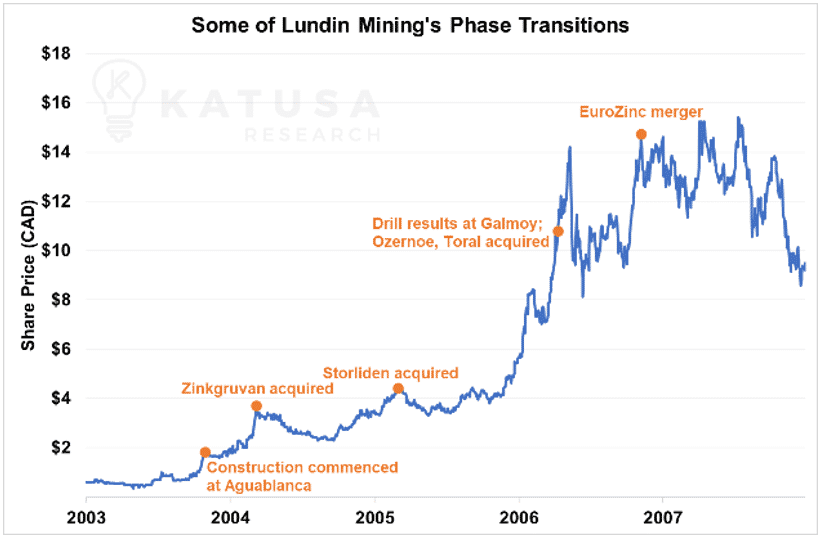
Each upwards spike in Lundin Mining’s share price coincides with a major acquisition or development in the company’s business. And as you can see, they even line up extremely well – if I draw a line through each of the orange points, I end up with an R2 value of 0.932 (which basically means that they line up fairly well).
- Does that mean Lundin Mining is going to keep trading along that line as long as they continue to pick up new assets?
The answer, of course, is no – not unless Lundin Mining’s new assets (or phase transitions if you will) actually add significant enough value to the company to keep driving its share price along that trend.
It’s theoretically simple to do this in mining, on paper at least…
For a very basic calculation, you can take the discounted NPV of newly acquired mine and see how it adds to the market capitalization of a mining company (less any cash or debt paid for it, of course).
This of course is theoretical, because unknown issues such as metallurgical or recovery rates or new taxes could affect the value. But you get the point.
For something like Bitcoin, there’s no simple way to quantify when – or even if – it’ll see another phase, let alone how much it’d be worth.
S2FX Model
The chart below shows the monthly BTC S2F and price data points used in the original S2F model. One can visually identify four clusters.
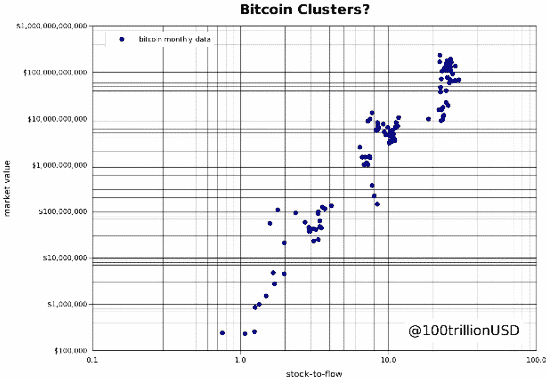
These four clusters could indeed indicate phase transitions.
Quantifying these clusters can be done by minimizing distance between monthly BTC data and clusters. I use a genetic algorithm (minimizing absolute distance) to quantify four clusters. Future research could focus on different clustering algorithms (e.g. k-means algorithm).
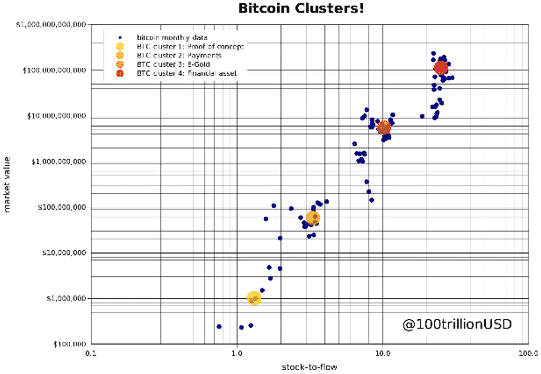
Each of the four identified BTC clusters has a very different S2F-market value combination that seems to be consistent with halvings and changing BTC narratives.
BTC “Proof of concept” (S2F 1.3 and market value $1M)
BTC “Payments” (S2F 3.3 and market value $58M)
BTC “E-Gold” (S2F 10.2 and market value $5.6B)
BTC “Financial asset” (S2F 25.1 and market value $114B)
Like water and US Dollar these four BTC clusters represent four different assets, each with different narrative and characteristics. BTC “Proof of concept” with S2F 1.3 and only $1M market value is a totally different asset than BTC “Financial asset” with S2F 25 and $114B market value.
Katusa’s Comments
On Bitcoin Clusters:
It’s important to note that this section has nothing to do with the actual mathematical pricing model introduced by S2FX.
Rather, it simply explains when phase transitions previously occurred in the history of Bitcoin. The author groups the historical Bitcoin data points into clusters based on these phase transitions.
The most important takeaway from this section is that the author uses these clusters to reduce the size of their data set from several dozen points to four.
Why is this a bad thing?
Statistically, there’s nothing wrong with doing so.
The problem is that the author uses these four “phase transition” clusters to calculate their model.
What this means is that their model doesn’t actually predict where Bitcoin is going – it predicts where Bitcoin’s phase transitions are going. Key phrase there is Bitcoin price vs. phase transitions.
This might not sound like a big deal, but…
The “Clusters” Exposes Two Problems:
The first problem is that it makes the S2FX model a poor predictor of actual price. Take a look at this cluster, for instance:
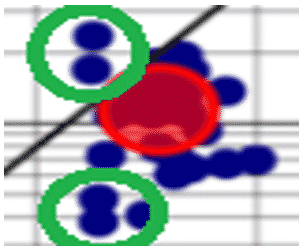
Take a look at the data points I’ve circled in green.
These data points occur at the same SF ratio. They look pretty close together, right?
Don’t be fooled. That’s because this chart is logarithmic.
In a logarithmic chart, the axis are exponential.
In other words, as you go up the chart, each point of data isn’t incrementing by 1, but by a power of 10 (not 1,2,3 but think 1, 10, then 100, then 1000).
The higher of the top two values is over $200 billion. The higher of the lower two values is roughly $50 billion.
That’s a variance of 75% at the same SF ratio.
Imagine if I built a model, and I told you that it predicted a price of around $6 for a particular asset.
But the price of that asset traded as high as $10, and as low as $2.50 when the model predicted $6.
Would you call that a good model?
The second problem is that by basing the S2FX model on Bitcoin’s phase transitions instead of on Bitcoin’s own performance, that makes the model dependent on future phase transitions.
According to the S2FX model, Bitcoin prices fall into clusters based on Bitcoin’s phase transitions.
The model predicts where these clusters go – not the prices themselves.
In other words, that makes the S2FX model reliant on future phase transitions to drive Bitcoin prices. We’ll return to this idea later.
Using the S2FX Model to Compare Bitcoin to Gold and Silver
S2FX Model
With the phase transition perspective of BTC clusters as different assets, I can now add other assets like silver and gold to the model. This makes it a real cross asset model. For silver and gold I use stock and flow numbers from recent analysis by Jan Nieuwenhuijs [6] and ultimo December 2019 prices from TradingView.
5. Silver S2F 33.3 (900,000/27,000 tonnes) and market value $561B
6. Gold S2F 58.3 (190,000/3,260 tonnes) and market value $10.088T
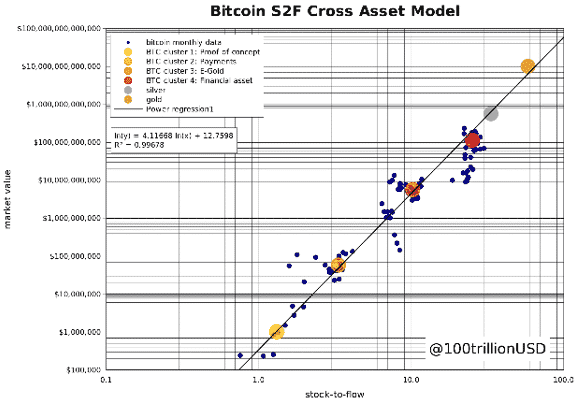
The chart shows the four quantified BTC clusters (plus the original BTC monthly data for context), silver and gold. They form a perfect straight line.
Katusa’s Comments
On Gold and Silver in the S2FX Model:
Alright, now I get to play in my sandbox, as I know a thing or two about gold and silver.
Gold and silver have traded in a wide range these last few years. Gold, for example, has traded as high as $11 trillion in market capitalization, and as low as $5 trillion. Its SF ratio has also changed slightly over the years.
Despite this, instead of using several dozen different points of historical data like they did for Bitcoin, the author arbitrarily chose numbers from December 2019.
Here’s what happens when we try to apply the S2FX model to historical data instead:
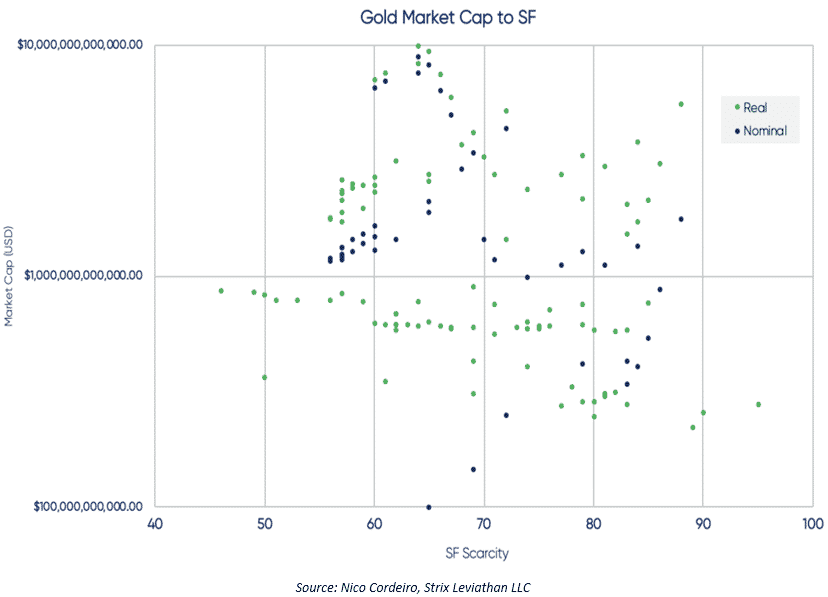
As you can see, when 115 years’ worth of historical data points for gold’s market capitalization versus its SF ratio are plotted, we get a scattered mess with no real correlation. Even when adjusted for inflation, any single sample SF ratio yields a range of historical market caps well over the hundreds of billions of dollars.
Now, let’s do the same thing for silver.
We calculate and plot silver’s historical market capitalization and SF ratio, using the last three decades’ worth of data, and compare it to the S2FX model.
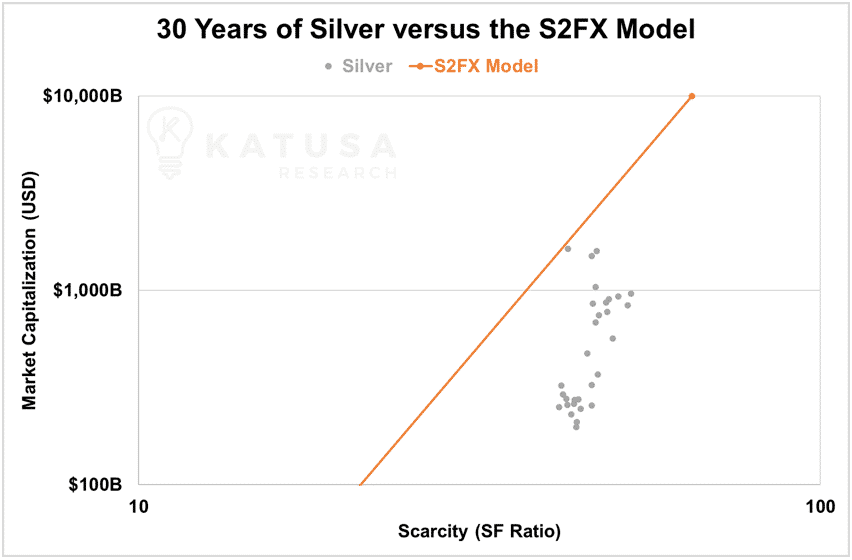
As the chart above shows, the S2FX model does a poor job of predicting silver’s historical performance.
Even when using the S2FX model’s own silver stockpile numbers, you end up with silver trading at $804 billion market cap at an SF of 20.87 in 2010, while it also traded at $301 billion market cap at an SF of 20.57 in 2006.
- In-between those two data points, at an SF ratio of 20.72, the S2FX model predicts a market capitalization of $91.3 billion.
Simply put, the S2FX model is way off for gold and silver. Which means that the data points for gold and silver used by the author aren’t valid – they were cherrypicked to fit the model.
S2FX Model
I use regression analysis to make the S2FX model. Note that a big difference with the original S2F model is that I use silver and gold S2F and market value data in the regression analysis. S2FX model shows a significant relationship between S2F and market value of these six assets (low p-Values F-test and low p-Values coefficients) with a perfect fit (99.7% R2).

The S2FX model formula can be used to estimate the market value of the next BTC phase/cluster (BTC S2F will be 56 in 2020–2024):
Market value = exp(12.7598) * 56 ^ 4.1167 = $5.5T. (emphasis by Katusa)
This translates into a BTC price (given 19M BTC in 2020–2024) of $288K.
Katusa’s Comments
On Gold and Silver in the S2FX Model:
Let’s take a closer look at the model in question:

This type of equation is known as a constant elasticity function. It’s well known in economics as the shape of demand curves.
But as mentioned previously, remember – this model doesn’t track Bitcoin prices. It tracks Bitcoin’s phase transitions.
According to the model, Bitcoin is going to hit $288k somewhere in 2020-2024.
What phase transition does this correspond to? Where else can Bitcoin go from here now that it’s already considered an uncorrelated financial asset?
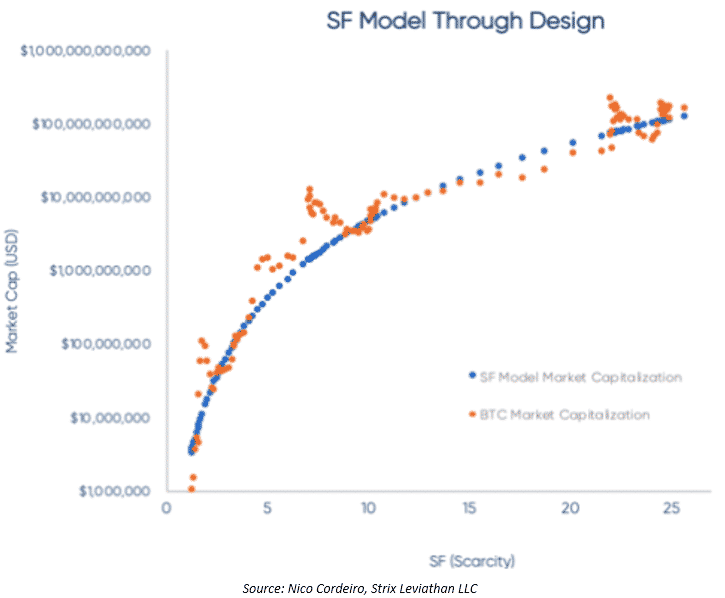
Furthermore, if you plot out the model, you’ll see that it predicts that Bitcoin will, on average, double every year for the next 30 years. How many phase transitions is that supposed to be? How many times can we re-think Bitcoin’s purpose and change how we view it as an asset?
S2FX Model
BTC price forecast is significantly higher than $55K in the original study. Please be aware that the S2FX model is a first step that has not yet been replicated and reviewed by others.
Although six observations is low, nevertheless I value the results of the S2FX model relevant. I see S2FX model as a working hypothesis, like S2F model. Future research could focus on adding more assets to the analysis. However, most assets have low S2F values (≤1) and are therefore not interesting. On the contrary, diamonds have a high S2F but have a very complex valuation (rough/cut, carats, different colors and brightness etc).
S2FX model allows for interpolation, instead of extrapolation in the original S2F model. The original S2F model makes a forecast that falls outside the data range used in making the model. The new S2FX model makes a forecast that falls within the data range used in deriving the formula.
Example of interpolation (left) and extrapolation (right) — data in blue, black line is model, red dot is forecast
S2FX model allows for interpolation, instead of extrapolation in the original S2F model. The original S2F model makes a forecast that falls outside the data range used in making the model. The new S2FX model makes a forecast that falls within the data range used in deriving the formula.
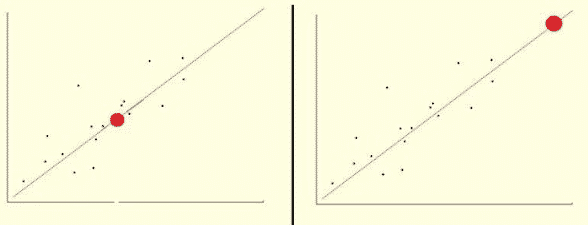
Example of interpolation (left) and extrapolation (right) — data in blue, black line is model, red dot is forecast.
Katusa’s Comments
On interpolation vs extrapolation:
I like this author. He can now say his model has been reviewed by others, namely, me.
- Whether you accept or challenge my conclusions here, everyone needs to keep the responses professional and respectful, on both sides.
The author of the model states that his new model can make forecasts that fall within the data range used in deriving the formula.
This would be important if true. A model that predicts future results solely based off past performance is not a very good model.
However, a model that predicts future results based on data that’s already happened before tends to be stronger.
In this case, however, this “data that’s already happened before” are the data points for gold and silver.
On paper, there would be nothing wrong with this if the data points were valid.
The problem is that these data points were cherrypicked by the author to fit their data.
As covered above, the S2FX model fails to properly track gold and silver when historical prices are used.
In other words, the S2FX model can still only predict future prices based on previous historical Bitcoin prices. The forecasts it makes fall outside the data range used in making the model.
Why is this a problem?
There’s no mathematical justification for why Bitcoin is supposed to follow this model exactly in the future, beyond the fact that historical Bitcoin prices and SF ratios fit this model.
Remember, those data points for gold and silver the author added were cherrypicked to fit the model and aren’t valid. That means the S2FX model’s correlation is purely built on Bitcoin’s past performance.
Are we supposed to believe that Bitcoin prices will continue to follow the S2FX model simply because it has in the past? S2FX might give us an idea of the general direction Bitcoin prices are headed in at this very moment, but as more time goes by, there’s an increasing chance of it becoming less accurate and meaningful.
If you’ve been investing for a while, you’ve probably seen this warning, or some variation of it before: “Past performance is no guarantee of future results.” This is true of all investments.
The story’s the same when it comes to Bitcoin.
S2FX Model
Conclusion
In this article I solidify the basis of the current S2F model by removing time and adding other assets (silver and gold) to the model. I call this new model the BTC S2F cross asset (S2FX) model. S2FX model enables valuation of different assets like silver, gold and BTC with one formula.
I have explained the concept of phase transitions. Phase transitions introduce a new way of thinking about BTC and S2F. It led me to the S2FX model.
S2FX model formula has a perfect fit to the data (99.7% R2).
S2FX model estimates a market value of the next BTC phase/cluster (BTC S2F will be 56 in 2020–2024) of $5.5T. This translates into a BTC price (given 19M BTC in 2020–2024) of $288K.
Solidifying known facts from the original S2F study, the S2FX model offers a new way of thinking about BTC transitioning into the fifth phase.
Katusa’s Comments
In conclusion:
As we’ve demonstrated, the S2FX cross asset model does not actually apply to gold and silver as advertised.
The phrase “phase transitions” was coined by the author, but the concept it represents is not. Besides which, there’s no guarantee that Bitcoin will see another phase transition in the future.
This model was built on four data points – remember, the gold and silver data points were cherrypicked and thus not valid.
Finally, recall what was mentioned about how the S2FX model is built on Bitcoin’s price clusters, and not Bitcoin prices themselves.
Let’s take a closer look at just how unreliable the S2FX model is when it comes to accurately predicting Bitcoin’s performance.
To pick an even more glaring example than our first one: based on the historical Bitcoin data used in the S2FX model, you can see that around the SF ratio of 22, Bitcoin has both traded below $10 billion while also having traded above $200 billion. In other words, the model can be off by a factor of over 20 times. People should know the reality of this such that:
- That $288,000 Bitcoin price by 2024 could actually just be $14,400!
Let’s get an even better idea of how little Bitcoin’s market cap performance actually depends on its SF ratio by charting the variance of the two against each other:
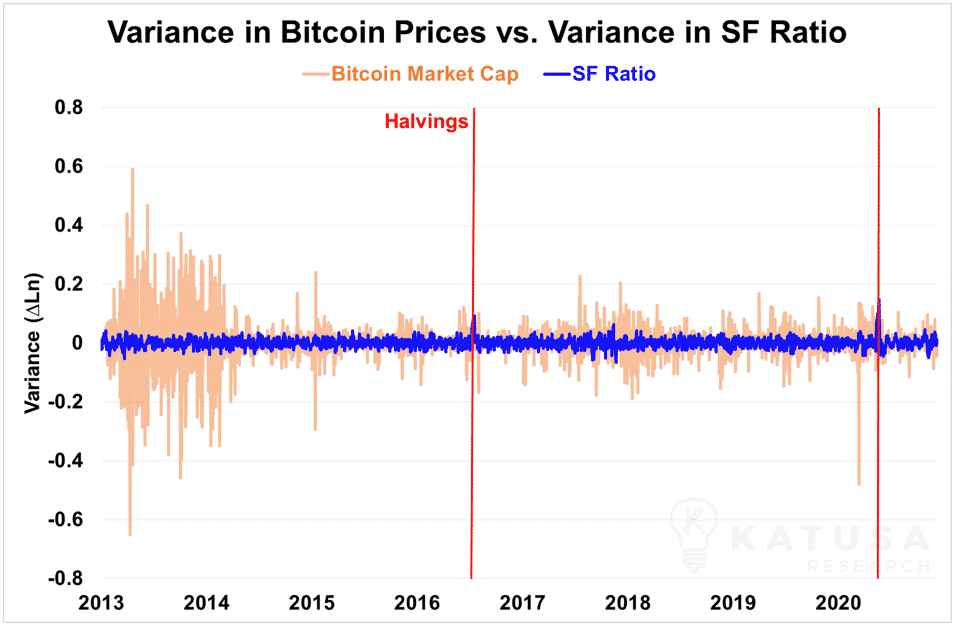
As the chart above shows, in general the SF ratio barely moves at all, except immediately following halvings. On the other hand, Bitcoin’s market cap and price, as you likely already well know, have been extremely volatile over its trading history.
According to the S2FX model, these two variables – Ln (Market Cap) and Ln (SF Ratio) – are supposed to have a linear relationship. Simply put, one goes up when the other one does, and vice versa.
However, historical data going back to 2013 shows that changes in the two variables have a correlation of 0.009. These two variables are about as unrelated as can be – when one goes up, the other one has about a 50/50 chance of going up or down!
In other words, the S2FX model may provide an interesting model to explain Bitcoin’s past performance, but it can’t accurately predict Bitcoin’s price, and can’t be counted on to predict Bitcoin’s future results.
Other Problems with S2FX
I have a few other concerns with the S2FX model that I haven’t been able to address yet. I’ll go over them now.
Let’s return, for a moment, to the S2FX model’s lynchpin equation:

If you ignore all of the numbers in that equation, what it says is simply this:
Market Cap is related to, and only to, an asset’s SF Ratio.
Recall that the SF Ratio is calculated with Stock / Flow. It’s a measure of scarcity, or hard it is to get your hands on something.
The author of the S2FX model quotes computer scientist and cryptocurrency pioneer Nick Szabo on what scarcity means. In his words, scarcity refers to items or assets that are “… costly, due either to their original cost or the improbability of their history, and it is difficult to spoof this costliness.” He calls this scarcity unforgeable costliness.
Bitcoin, of course, is what this statement refers to. After all, it’s extremely difficult – not impossible, but nearly so – to “fake” Bitcoin.
But what happens when the “Flow” in “Stock-to-Flow” hits 0?
Those of you who still remember your high school math likely know the answer to this one.
Well, if you use your basic calculator and divide by zero, you will get an error. No, error is not a fancy new quantum number.
But the closer we get to zero, if you divide by that number, you get… infinity. Also, by the way, one of the coolest symbols in math:

In other words, the SF ratio of an item that’s no longer being produced is infinitely large.
However, if you plug this back into the S2FX model’s equation, what you get is infinitely large market cap. That translates to infinite prices.
Now, Bitcoin is a long time off from hitting zero flow – that’s not expected to happen until around the year 2140. Ironically, the same date applies for assets like gold and silver (pre-celestial mining of course).
There are other assets we can look at to see what happens when flow goes to zero, though…
And since I’ve talked about Edward Thorp, Einstein, Elvis and Ace Frehley in this missive thus far, I think it’s only natural I bring up the pride and joy of early 1700’s Italy, Antonio Stradivari…
[[And for the math fans out there, the logo for integration, ∫ actually came about because of Gottfried Wilhelm Leibnitz who was an incredible mathematician and musician. Ironically, his original logo for integration was not the one we know it as today, but a shorthand version of ſ (long s) character. Completely independently, Stradivari perfected the sound of the violin and the cut out (which looks like the integral sign used today in Calculus). It was widely accepted that a Stradivarius violin made a perfect sound, mathematicians took the cut out symbol on a violin and became the logo used for integration in Calculus (perfect calculation reference) and hence why the violin is on most calculus textbooks.]]
Antonio Stradivari and the Philosophy of Supply and Demand

What do antique violins and Bitcoin have in common?
Well, for one, they’re both “unforgeably costly”.
Famous violin-maker Antonio Stradivari has been dead for centuries. And yet his instruments, known as Stradivarius violins, are highly regarded by the musical world as the pinnacle of violin craftsmanship.
Every surviving Stradivarius violin is catalogued and tracked. While the best-made modern violins struggle to break the six-digit mark, several Stradivarius violins have been sold for millions of dollars each. They are, without a doubt, unforgeably costly.
- Since Mr. Stradivari is quite dead, no more of his violins can be made. In other words, the flow of new Stradivarius violins is zero.
According to the S2FX model, that would make his violins infinitely expensive. But while they’re certainly pricy, they don’t cost an infinite amount of money to buy.
The thing is, when the supply of something rare goes to zero, that means pricing is left solely in the hands of the people who want to buy that thing. In other words, the demand part of supply and demand dictates what the value of that thing is.
I have no interest in million-dollar antique violins, I prefer jamming out on a 1959 Les Paul Standard. I would wager that the majority of you have no interest in collection violins either.
But those Stradivarius violins are clearly valuable to some number of people out there.
Our long-dead Italian violin maker, Mr. Stradivari, certainly has no say in the pricing of his violins anymore. His inability to make new violins is not the only reason his violins are worth so much, or else every dead violin maker would have violins worth a lot of money.
Clearly the violin buyers have some way of judging the desirability of an old violin.
What the S2FX model fails to capture is this – the demand side of supply and demand.
Supply Ain’t the Only Rock Show in Town
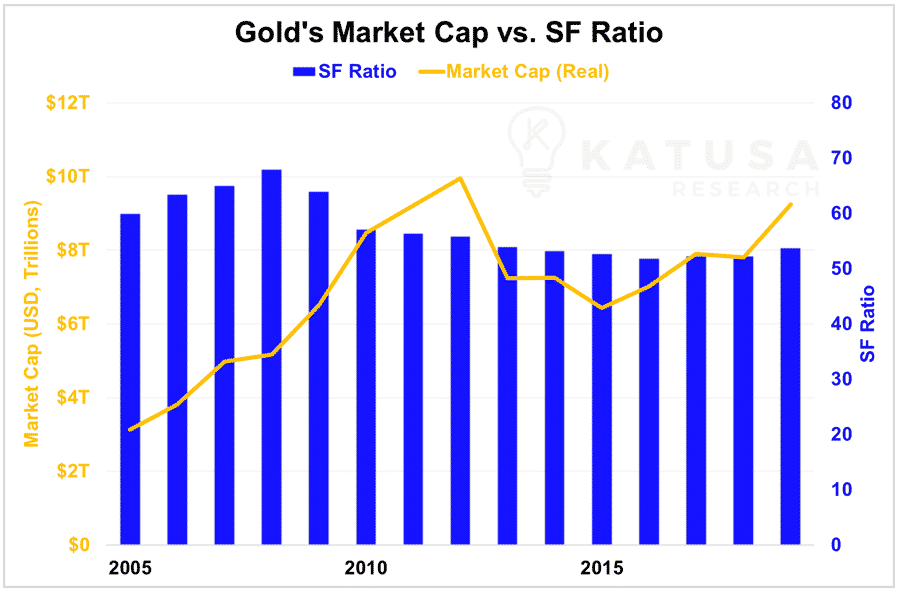
When gold had its dramatic bull run in 2011-2012, global stockpiles and production levels didn’t suffer any dramatic changes.
The price of gold did not run up to $2,000 in February 2012 because half the world’s gold stockpile had suddenly disappeared, or because mines worldwide were forced to shut down.
- In fact, between 2010 and 2012, Gold’s SF ratio went down which, according to the S2FX model, should have also caused prices to go down.
But they didn’t. Instead, prices broke to new all-time highs that would not be seen again until just earlier this summer.
It should come as no surprise, but the answer is simple: when it comes to pricing assets, supply is only half of the equation. And since the SF ratio is purely a supply-side metric, it cannot accurately price anything by itself.
Finally, don’t forget: Bitcoin isn’t the only cryptocurrency out there with limited supply. Bitcoin Cash, Ripple and Litecoin are also all in the same boat, to but name a few.
Shouldn’t the S2FX model should apply to all these coins too? Will they all be going to infinity at the same pace as Bitcoin?
Stop the Flow, and the Stock Still Goes
As our good friend Mr. Stradivari has shown us, even when an asset is no longer being produced, it will still change hands.
Price is a function of both supply and demand. (Doubtless, if Mr. Stradivari were still alive today and cranking out violins, they wouldn’t be quite as expensive as they are now.)
There’s more to Bitcoin’s price than just its SF ratio – or else it wouldn’t have traded both as low as $50 billion and as high as $200 billion at the same SF ratio.
In conclusion, I find the S2FX model to be inherently faulty, and not mathematically sound.
You’re free to disagree with me or even ignore me, of course – I’ve laid out my reasoning, and you’re welcome to pick apart my argument the same way I’ve done to the S2FX model.
That said, I still believe that Bitcoin will have a major role to play in the future.
I’m not a crypto-hater – far from it. Like I stated in the previous article, I have a significant amount of money invested in the crypto space myself.
But right now, Bitcoin is still in overbought territory, as per our previous article. If you’re a savvy investor keen on getting yourself a good deal, now is not the time to jump into Bitcoin.
Instead, you should remember that it’s the best time of year to be on the lookout for buying opportunities on the markets.
In fact I have my year end wish list.
And its available now for all Katusa subscribers now on our website
Regards,
Marin Katusa


