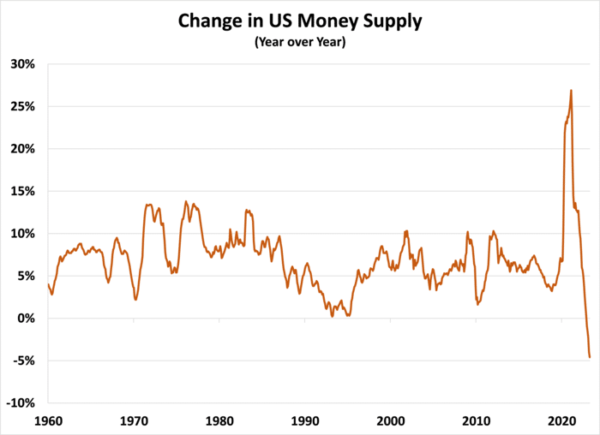
Step back and watch the confusion in the heart of the U.S. monetary system.Because while the nation remains captivated by ongoing political drama, a quiet transformation is taking place…All concealed within the corridors of the Federal Reserve.Notably, the U.S. Money Supply is experiencing a sustained contraction for the first time since at least 1960, with over $1 trillion being withdrawn.These developments are signaling a shift in the fiscal landscape of a country heavily reliant on cheap debt and loose fiscal policies.Let that sink in for a moment.Because we’ve got a few visuals you need to see, to believe…
Money Supply: Tightening the Taps
A country that has loaded itself to the gills on cheap debt and loose fiscal policy is finally starting to see the tightening of the fiscal taps, so to speak.
But wait, there’s more…
Interest Rate Surprises
Interest rates have risen from near zero up to 5.25%. If you can believe it, this is higher than the dividend paid on most investment-grade bonds today (and more on that later).
- And just this week, Fed Chair Powell indicated that two more rate hikes could be on their way.
But back to this point…The U.S. money supply is slowly contracting and the fallout effects from that aren’t something that has been seen in real time yet in this new global economy we live in.The chart below shows the U.S. M2 money supply (in green) which is composed of all the money in circulation, along with money in checking and savings accounts, retail investments in money market funds and term deposits under $100,000. In blue is the velocity of that M2 money supply.
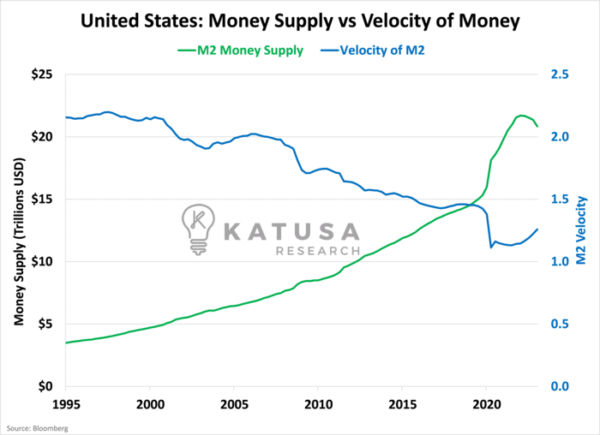
The velocity of capital is the number of times one dollar is spent to buy goods and services per unit of time. It’s calculated as the ratio of Gross Domestic Product (GDP) to Money Supply.In a sense, it represents the willingness of citizens to spend.
- If velocity is increasing, more transactions are occurring between individuals.
- If velocity is falling (like we have seen continuously for 25+ years), less transactions are occurring between individuals.
We can see the clear negative relationship between money supply and velocity of capital in the chart above. This is because money supply growth has outpaced GDP growth and indicates that every dollar doesn’t go as far as it used to.
Implications of Future Rate Increases
Looking ahead, it’s plausible that we see another 0.25%-0.50% rate increase over the next six months, which takes the Fed Funds target rate to 5.50%-5.75%.The reason?The primary driver behind these potential hikes lies in the Federal Reserve’s concerns regarding inflation. With its preferred inflation gauge standing at 4.40%, and a 4.7% reading when excluding food and energy, the previous significant interest rate adjustments aren’t fully reflected in the economy yet.
- I’ve said it before, these large interest rate increases are just beginning to work their way through the system.
The Copper Signal
Copper serves as an invaluable proxy for short-term economic expectations.The spread between immediate copper delivery and copper delivered one month ahead reveals a telling metric.Right now, the discount between these two points is the widest observed in the past 25+ years.As you can see in the chart below, it’s cheaper to buy copper for delivery right now than it is for delivery one month from now.And it’s the biggest discount in nearly three decades.
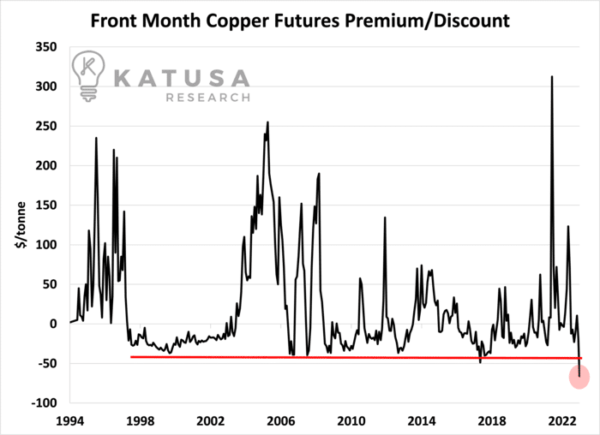
There are 2 possible reasons why there could be such a wide discount.First…A large amount of copper just became available.This is unlikely, as mines don’t just surprise the market with enormous quantities of copper with no warning. If anything, copper production is lower than expected due to political unrest in major copper nations.Recently, the only large copper mine put into production was Quebrada Blanca 2. Located in Chile, it’s a Joint-Venture between Teck 60%, Sumitomo 30% and the Chilean government 10%. This volume has been priced into the market.Second…Future copper demand is projected to be lower and as a result, copper sellers are forced to sell their product at a discount to sell out their inventories.Diving into this further we can look at the relationship between key global commodities, interest rates and recessionary signals.The next chart shows 3 items.
- Up top, a white line showing the price of Brent crude oil, the global benchmark for physically settled crude oil.
- In the middle, the U.S. Federal Reserve Target Interest Rate, and
- On the bottom, the U.S. recession probability forecast.

As you can see, as soon as the Fed started tightening, recession probability increased. And in lockstep, the price of crude oil began to fall.Copper shows a similar pattern.The chart below is the same setup. Copper in white, Federal Reserve Interest Rate in Blue, and the U.S. recession probability in red.

Again, we’re seeing that as the Federal Reserve increases the interest rate, the probability of a recession increases, and copper prices fall.Let’s take this all and make it easy to digest…
- The U.S. monetary system is going through unprecedented changes, including a sustained contraction in the money supply and rising interest rates.
- The decline in the velocity of capital suggests that every dollar is not going as far as before, impacting individuals’ spending habits.
- The wide discount in copper prices indicates potential concerns about future copper demand and inventory sell-offs.
- As the Federal Reserve tightens its policies, recession probabilities increase, and commodity prices like crude oil and copper start to decline. It’s crucial to monitor these economic shifts and adapt strategies accordingly.
- If you want to follow what I’m doing with my own money, join thousands of subscribers to my premium research…
Consider learning more and becoming a member of Katusa’s Resource Opportunities.Regards,Marin Katusa
Details and Disclosures
Investing can have large potential rewards, but it can also have large potential risks. You must be aware of the risks and be willing to accept them in order to invest in financial instruments, including stocks, options, and futures. Katusa Research makes every best effort in adhering to publishing exemptions and securities laws. By reading this, you agree to all of the following: You understand this to be an expression of opinions and NOT professional advice. You are solely responsible for the use of any content and hold Katusa Research, and all partners, members, and affiliates harmless in any event or claim. If you purchase anything through a link in this email, you should assume that we have an affiliate relationship with the company providing the product or service that you purchase, and that we will be paid in some way. We recommend that you do your own independent research before purchasing anything.
