
Today, give yourself a pat on the back.
You’ve just survived one of only FOUR times in 60 YEARS markets have swung this wildly.
In one of the most volatile weeks in history, what you’re feeling ranks with the 1987 crash, 2008 crisis, and 2020 COVID panic.
The next two weeks are key. If markets drop less than 2%, history shows a 40% gain ahead. If they fall more, we could face real trouble.
So, it’s no secret we’ve been cautious.
It’s no secret we’ve been cautious.
In fact, as my KRO subscribers know, I am sitting on the largest percentage of cash in my professional career.
As you expect, the alligator screens are crunching overtime trying to find the best balances sheets of the best assets of the best companies.
And when the alligator wants to feast, he looks for indicators that tell him a bottom is near…
Or that valuations are coming back down to earth.
So, rather than relying on gut feeling or headlines, we can turn to time-tested metrics that provide context about current valuations.
Mathematics dear Watson, Mathematics!
I’m going to zoom out from the daily noise, and show you what four classic indicators are telling me.
The Buffett Indicator: Flashing Red
Named after legendary investor Warren Buffett, this simple ratio compares the total value of the stock market to the size of the U.S. economy (GDP).
Currently, this indicator stands at 1.50, dramatically higher than its historical average of 1.02.
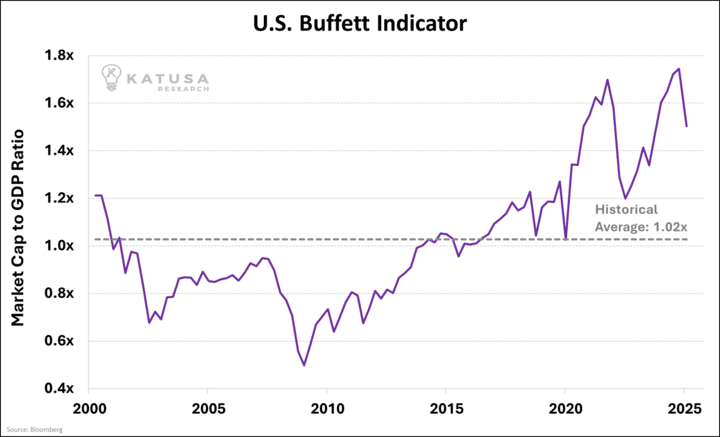
The stock market is still currently valued at nearly twice the size of the entire U.S. economy.
Even accounting for the increasingly global nature of American corporations, this level suggests significant overvaluation.
The last time we saw readings this high was during the dot-com bubble of the late 1990s, which was followed by a painful market correction.
Shiller CAPE: Approaching Bubble Territory
The Cyclically Adjusted Price-to-Earnings ratio, developed by Nobel laureate Robert Shiller, smooths out short-term earnings fluctuations by using 10 years of inflation-adjusted earnings.
- The current CAPE ratio stands at 34.97, more than double its historical average of 17.58.
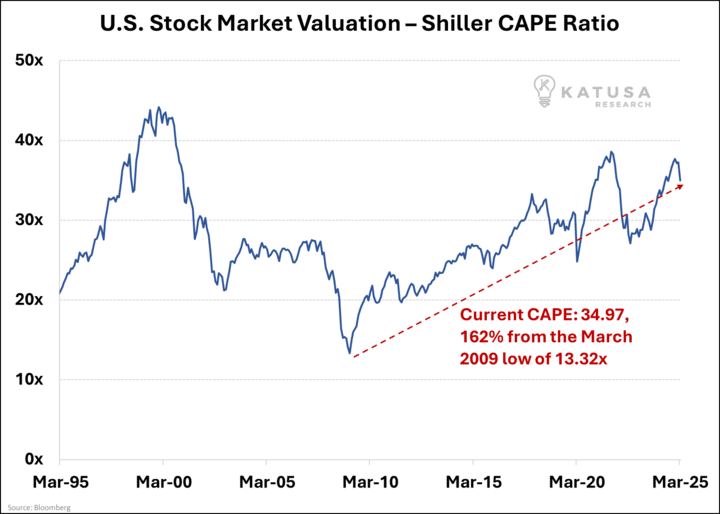
- By this measure (recent correction included), stocks are still historically expensive.
While still below the all-time high of 43.77 reached during the dot-com bubble, today’s level has only been exceeded twice in history:
- During the aforementioned tech bubble and
- Briefly before the 2008 financial crisis.
Note: For those who follow Shiller’s methodology, note that the trailing 10-year average includes the 2020 crash, which skews the data slightly…
High CAPE readings have historically been associated with lower future returns over the subsequent decade.
Forward Valuation:
Conclusion: While Europe and Japan Drink Tap Water, the U.S. Is Pounding Champagne
There’s a fine line between a valuation premium and just being flat-out expensive.
Even after the recent sell-off, the S&P 500 is still trading well above its long-term average forward P/E.
Meanwhile, over in Europe, the Stoxx 600 is calmly cruising near its historical norms.
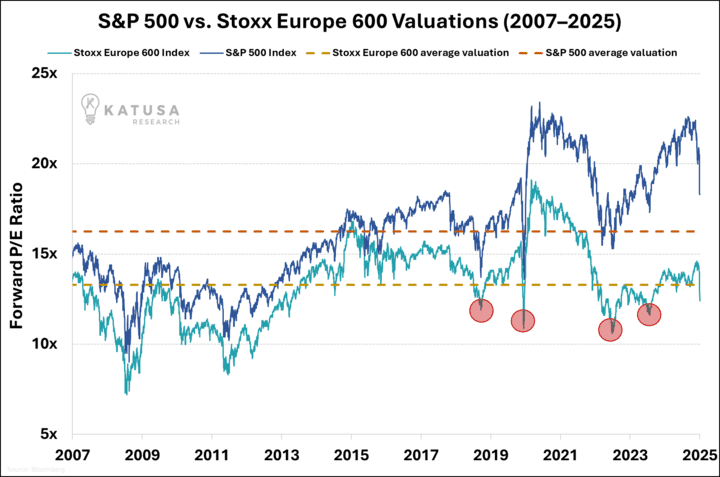
The chart shows that the gap between U.S. and European stock valuations is growing.
Whenever this spread gets too wide, we usually see one of two outcomes:
- U.S. companies somehow deliver extraordinary earnings to justify the party (rare), or
- U.S. valuations revert to earth—and fast.
The Rise of America deserves a premium, but perhaps that premium will be readjusted, and I think it will.
Earnings growth is slowing, margins are shrinking, and macro risks loom on both sides of the Atlantic. Europe’s priced closer to reality, the U.S. – which attracts big capital more than others- is priced for fantasy.
And let’s be honest, champagne hangovers always hit the hardest.
Investor Sentiment: Sentiments in the Basement, But the Bill’s Still Sky-High
AAII Bullish Readings Hit 2-Year Lows, So Where’s the Discount?
The bulls have gone missing, and they didn’t leave a note.
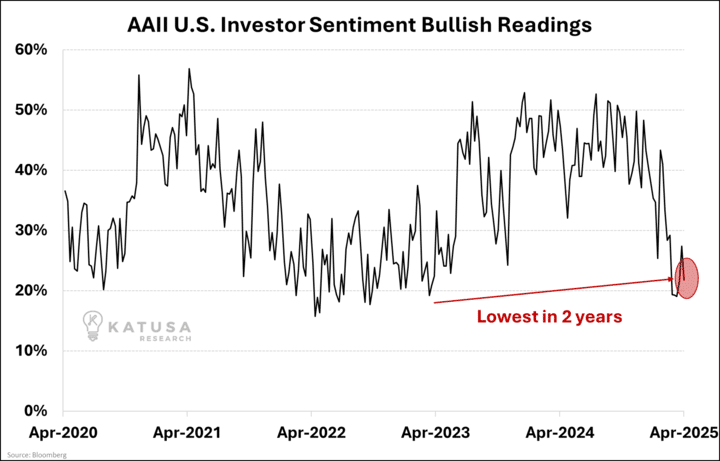
As per the chart, just around 20% of investors are feeling bullish, marking the lowest reading in two years. That’s typically the kind of washout that screams, “the bottom is near.”
- But here’s the problem: prices haven’t caught up with the fear.
Normally, when sentiment craters, it’s because stocks are already cheap and ugly.
Today, they’re still expensive and investors are just starting to notice.
That’s a dangerous mix: low conviction plus high valuation leaves the market with no cushion if things go wrong.
If earnings miss, macro data slips or inflation rears up again, there’s no margin for error.
The Bottom Line: Get Your Shopping List Ready
The signs are clear…
Whether it’s Buffett’s favourite indicator, the sky-high Shiller CAPE, the widening transatlantic valuation gap, or sentiment buried in the basement…
Nothing in this market is screaming “cheap”.
Yes, there’s been a pullback. But it’s more of a sneeze than a flush.
This isn’t the time to go all-in, but it is the time to be building your watchlist.
Here’s what I’m doing personally:
- Maintaining cash for potential screaming buying opportunities
- Being selective about stock purchases: focusing on companies with strong balance sheets and reasonable valuations
- Preparing for increased volatility as markets eventually readjust to more sustainable valuations
Remember that these indicators are most useful for setting long-term expectations rather than making short-term trading decisions.
No valuation metric can predict exactly when markets might be correct…
But they do provide valuable context about the potential risks and rewards of current investment opportunities.
We just released the April issue of Katusa’s Resource Opportunities, detailing…
- 3 new gold buys were detailed after a deep dive into the gold sector.
You might not have heard of metrics and signals like AISC or Owner’s Earnings… but we break it down clear and simple. And reveal the best opportunities in the market right now.
Learn more about becoming a member.
Sometimes, even the dullest signals lead to the most spectacular outcomes.
And I’ve got my trigger finger ready.
Regards,
Marin Katusa
Must See TV…


Details and Disclosures
Investing can have large potential rewards, but it can also have large potential risks. You must be aware of the risks and be willing to accept them in order to invest in financial instruments, including stocks, options, and futures. Katusa Research makes every best effort in adhering to publishing exemptions and securities laws. By reading this, you agree to all of the following: You understand this to be an expression of opinions and NOT professional advice. You are solely responsible for the use of any content and hold Katusa Research, and all partners, members, and affiliates harmless in any event or claim. If you purchase anything through a link in this email, you should assume that we have an affiliate relationship with the company providing the product or service that you purchase, and that we will be paid in some way. We recommend that you do your own independent research before purchasing anything.
