HomeResearchGoldConnect the Dots: A Speculator’s Paradise is Heating Up
Connect the Dots: A Speculator’s Paradise is Heating Up
The U.S. Federal Reserve and central banks around the world appear to have the printing presses going full tilt these days.
This has fueled the greatest “V recovery” any buy the dip investor could have asked for.
Tech stocks and precious metals stocks alike have been among the best performers and outperformers YTD (and we’ll get to the attention they’re attracting in a minute).
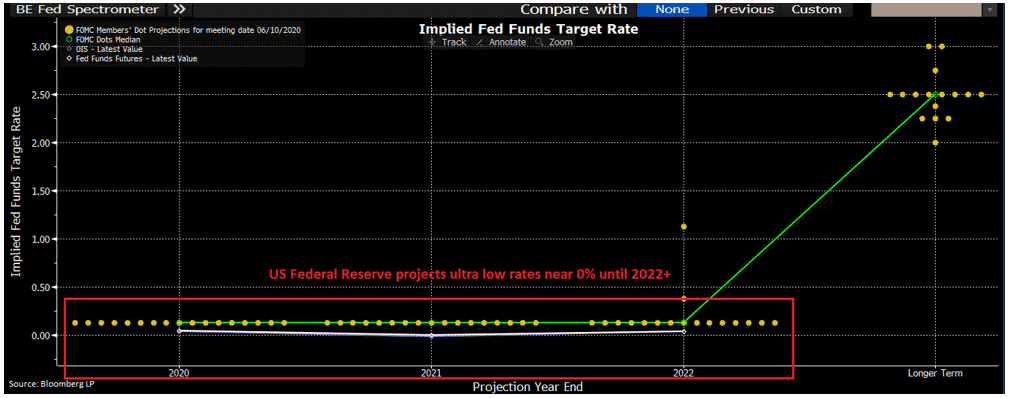
Below is a chart which shows the expectations for future interest rates. Each dot represents the expectation of future interest rates for each Federal Reserve Open Market Committee member. You will see that no member expects to move away from ultra low rates until at least 2023.
What Does the Fed Dot Plot Mean?
To me it means that the Fed officials know the economy is not functioning properly and will not for a long time.
It signals that the Federal Reserve believes the banking climate must remain ultra supportive for businesses to remain open.
This has led to an enormous disconnect between the stock market and the economy.
Historically, the stock market was a useful barometer of economic health. That’s hard to argue today.
To start the year, U.S. unemployment was approximately 3.5%, an all-time low. Last month U.S. unemployment was over 13%. It is hard to see a picture of economic growth and stability like we saw in January this year.
So why are the stock markets within shouting distance of highs?
The answer lies in the ultra cheap credit and enormous financial backing of the U.S. Federal Reserve.
Except a lot of this capital is not going from Wall Street to Main Street.
Perhaps this next piece of information will spark your curiosity, as it did mine…
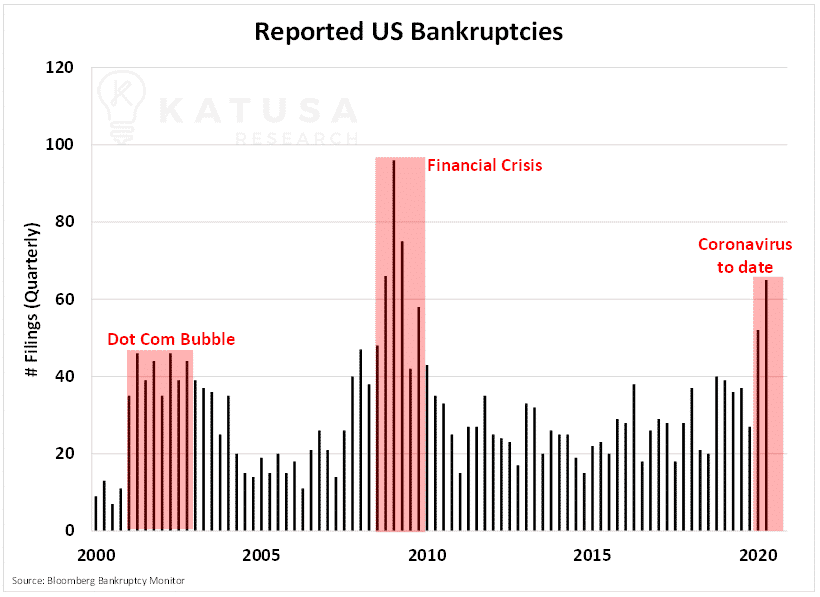
U.S. Bankruptcies Hit 11 Year High
Through the first 6 months of the year, bankruptcy filings in the United States have hit levels not seen since the peak of the Financial Crisis.
They have already surpassed the peak from the Dot Com tech bubble.
Below is a chart which shows the reported public and private bankruptcy filings in the United States.
While unemployment is worrisome, bankruptcies are much worse.
And this is why the Federal Reserve is buying corporate bonds.
If companies fail, who is going to rehire all the unemployed workers? Where is government tax revenue going to come from?
This is a very scary, slippery slope to navigate.
Connecting the Next Dot: Velocity of Capital
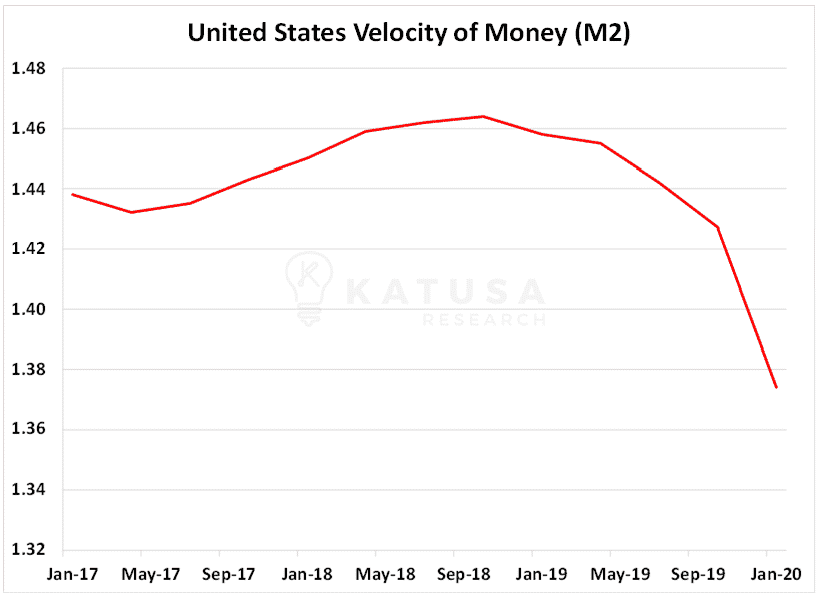
The next domino that falls in this situation is the velocity of capital. As bankruptcies increase, the velocity of capital slows.
The velocity of money is the number of times one dollar is spent to buy domestically produced goods and services per unit of time.
The higher the ratio, the more turnover of dollars there are. This velocity of capital is measurable through the Velocity of Money indicator.
Next, you’ll see a chart that shows the rapid decline in the velocity of the United States M2 money supply.
With all of Donald Trump’s “Buy America” focus, this should have increased the velocity of capital. Just the opposite happened. And Coronavirus put a nail in the coffin.
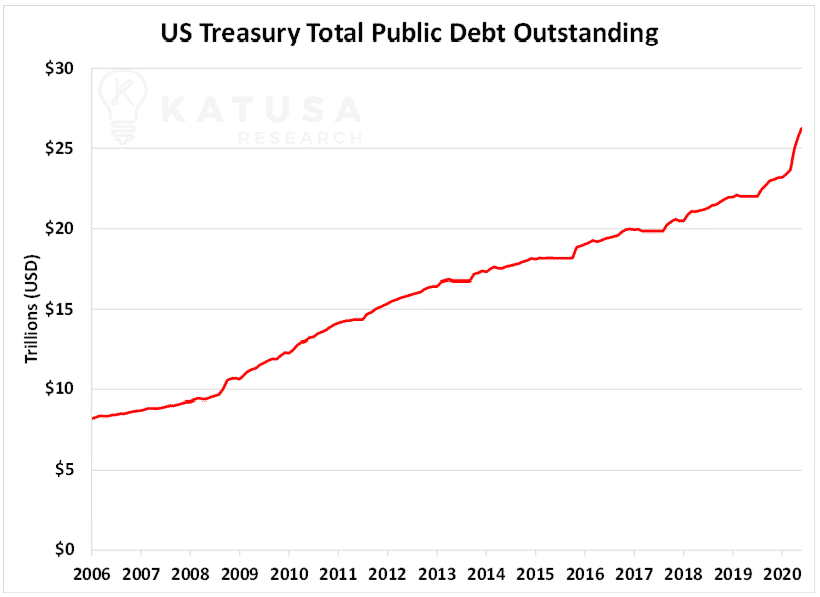
At the same time, public debt held by federal, state and municipal governments and banks is at all time highs.
Pushing against the string will only work for so long before the chickens come home to roost.
So How Do You Protect Your Portfolio?
I’ve long said that the person who wins in a deflation is the one who loses the least. That’s why I am positioned strongly in precious metals stocks and U.S. Dollars.
I think most viewing this get the gold exposure.
But the U.S. Dollar exposure confuses and even hangers a lot of people.
As bad as you think the situation is in the U.S., the rest of the world is in an even worse situation.
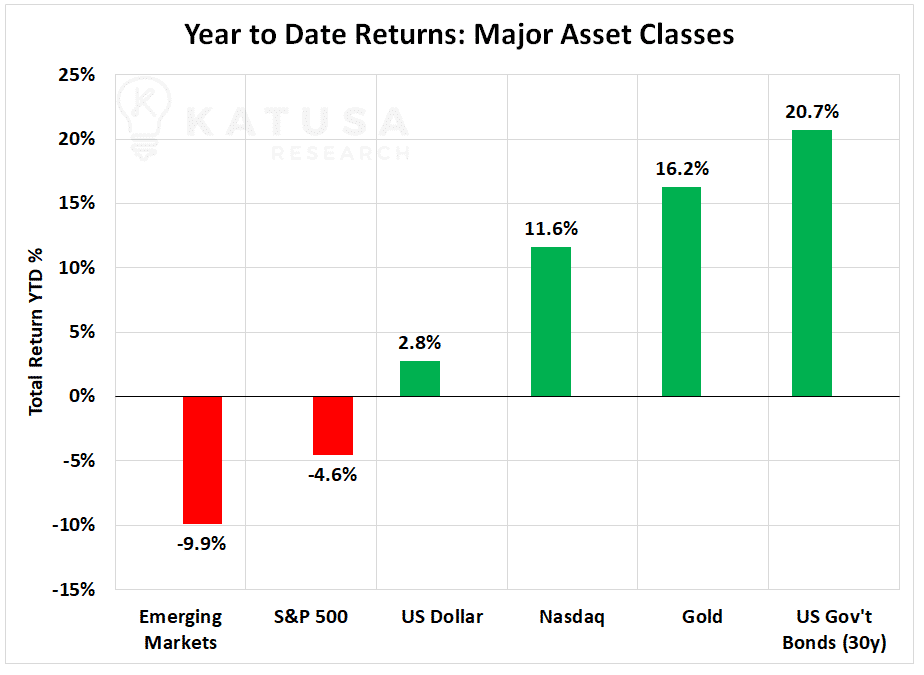
This year gold is the second-best performing asset class. First is United States 30-year bonds.
These are the big winners this year for good reason…
Slowing of capital movements, high unemployment and low productivity all point towards stagflation and an eventual deflation could be on the horizon. This drives demand for safe haven assets like gold and government bonds.
Gold Market Moves and Analysis
Today we have a plethora of stimulus packages and low interest rates.
In addition, global politics are on a knife edge. Not to mention we are combatting a virus that has killed 474,000 people around the world, which we cannot create a vaccine for.
This is a highly favorable environment for gold and gold stocks.
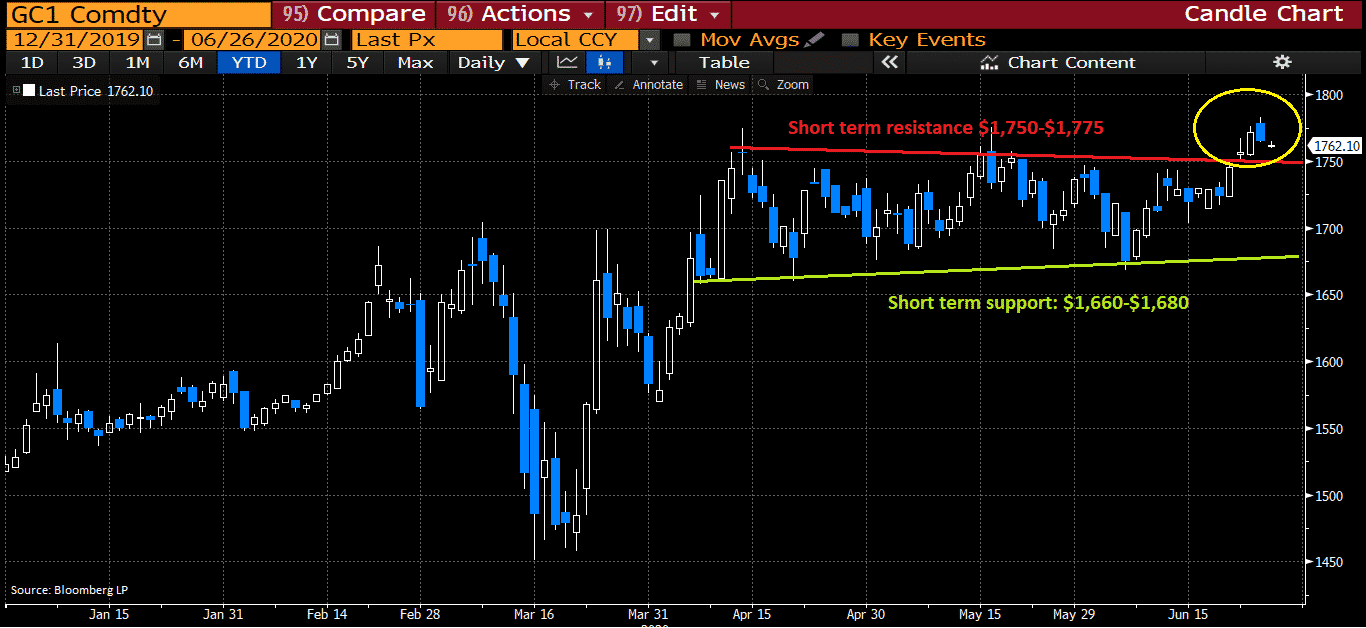
In the chart below you will see gold has consolidated well in this upper range and has broken above its short-term resistance line.
This week gold tested the waters above $1,750. I do think more consolidation is fine around this price level.
The next level of resistance for gold is ~$1,800 per ounce.
If gold can clear $1,800 with momentum and volume, the highs of $1,900 could be reclaimed fast.
And that is when the fun starts!
New highs attract speculators and momentum.
All the “gurus” that complain about algorithms and day traders will suddenly welcome them all with open arms.
The reason?
They bring much needed liquidity and speculation into the sector. Neither of which the sector has truly in a decade.
Can You Day Trade Gold Stocks?
Small players can day trade with ease. Of course, if you know what you are looking for and can interpret drill results or economic studies faster than others.
But big trading outfits need millions of dollars worth of volume in names they trade in. Not to mention a liquid derivatives market.
Most of the junior resource stocks don’t do that kind of volume in a month let alone in a day.
If gold breaks out, we will see a massive influx of new retail speculators enter the space.
Speculation is an integral part of the natural resource sector.
That’s Why You Need to be Ahead of the Herd
Picking up pennies in front of a steamroller works for a while.
But positioning yourself in world class operators before the speculators and other market “gurus” pile in is how you make needle moving, wealth changing investments.
A few years ago, my subscribers and I made a fortune in a gold company called Northern Dynasty.
My due diligence told me this was a stock that was poised to scream higher. It did…
Retail investors (aka the herd) drove prices from $0.45 to over $4.00 per share.
At the same time, the Northern Dynasty warrants (which are like a call option) were trading at nearly the same price as the stock.
This was pure retail speculation.
And it can spike share prices like a hockey stick hundreds, even thousands of percent… in a very short amount of time.
You’ve seen in the U.S. markets over the past few months in Hertz, Nikola, Chesapeake Energy and many others making 100% gains look like small potatoes.
The good news is this gold bull market is still in the early innings.
Right now, I’m making big moves and putting millions of dollars into the market in precious metal stocks and into other hated, unloved and undervalued sectors.
The main focus is positioning myself and my subscribers into companies with management teams with skin in the game…
And cost base the same as our own…
With Gold projects that deliver strong financial returns at $1,500 per ounce gold and have exceptional leverage to rising gold prices.
We use cookies to ensure that we give you the best experience on our website. If you continue to use this site we will assume that you are happy with it.Ok