“How far the coronavirus will spread is yet to be determined, but its current reach will be enough to slow major economies around the world.”
I wrote those words in February in my newsletter as my team and I went deep into China’s GDP numbers and world supply chains.
Here’s what’s coming down the pipeline:
- Global GDP numbers for Q1 will be significantly lower
- Most sectors will also experience lower earnings for Q2
- The unknown now is to what extent Q3 earnings will be impacted
I’m not taking any chances.
We have intentionally positioned our KRO portfolio heavy in gold and U.S. Dollars and we are doing incredibly well.
China’s Numbers Indicate a Worldwide Slowdown
The coronavirus in China and the rest of the world revealed a hard-economic truth: a broken growth story.
- In the transition from growth to fundamental value, capital will always flee to safety.
That is why we have seen the price of U.S. 10-year treasury notes rocket to all-time highs—meaning the lowest yields ever.
As I’ve stated many times before, this financially transmitted disease (FTD) is going to push global yields lower for longer.
This also means that further compression in the market should be expected.

In the charts that follow, we’ll look at the increase in global reliance on China.
Today, China plays a massive role in the global supply chain system. It is a key manufacturing hub that consumes and produces trillions of dollars worth of goods every year.
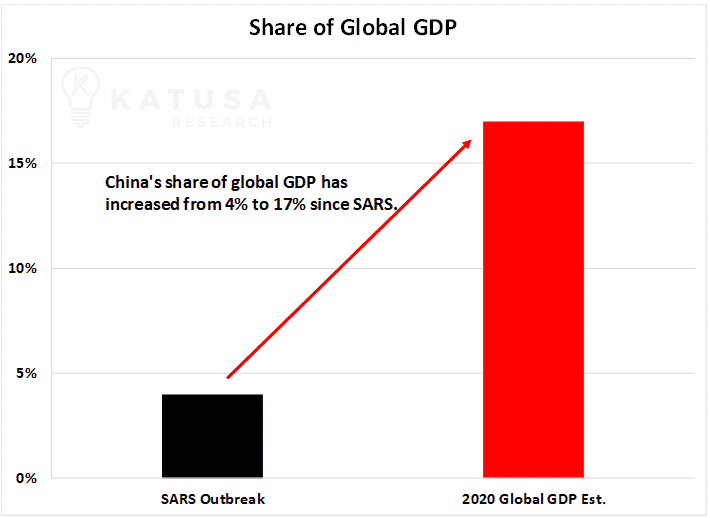
Globalization has increased over the past two decades, and we need international trade for everyone to prosper. The country’s increased share of global GDP indicates just how intertwined China is with the rest of the world.
Below is a chart that compares China’s share of global GDP back in 2003 during the SARS epidemic to this year’s pre-coronavirus global GDP estimate.
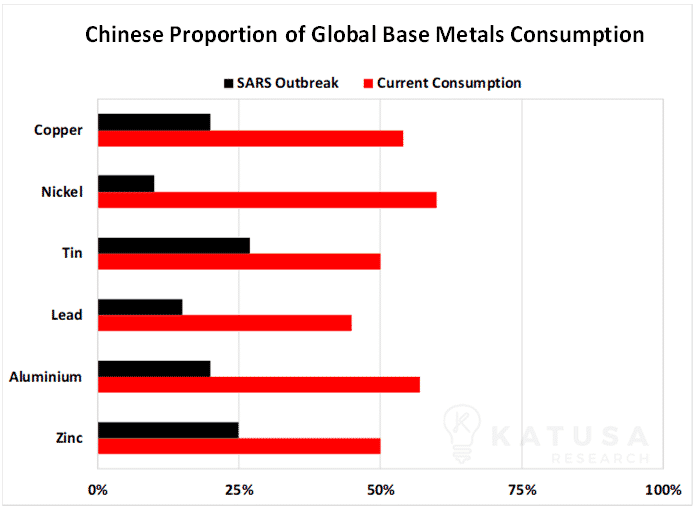
The next chart shows the proportion of Chinese consumption for base metals in 2003 during the SARS outbreak and initial estimates for 2020 (pre-coronavirus). As you can see, China makes up about half of global base metal demand.
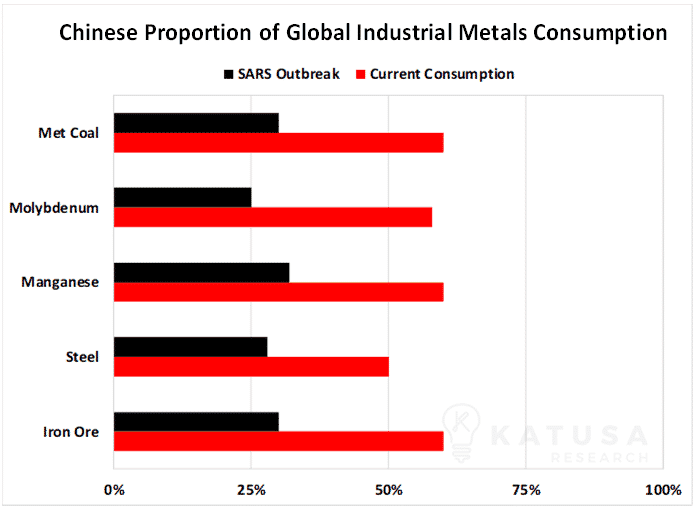
Below is a chart showing the consumption of Industrial metals in 2003, compared to this year’s estimates (pre-Coronavirus).
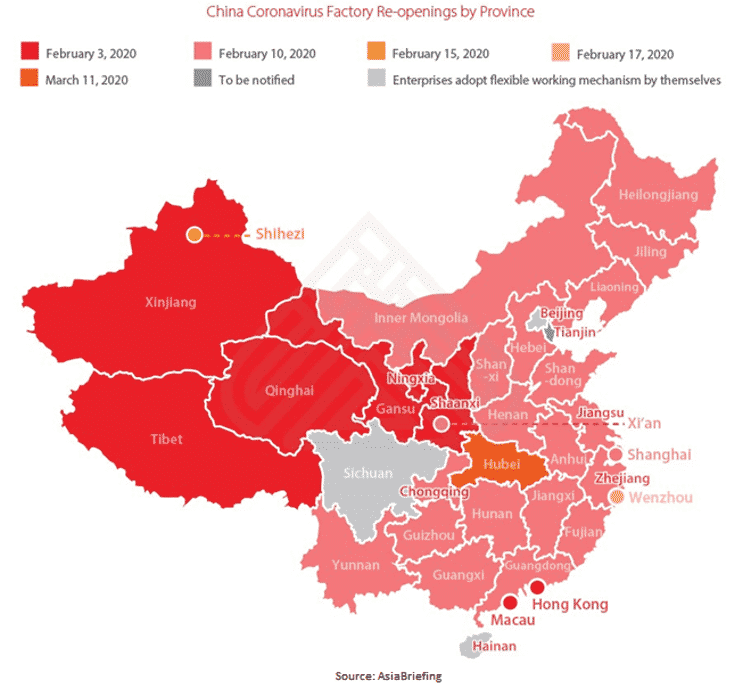
The heartbeat of China is its manufacturing sector. Below you’ll see a map that shows the estimated restart dates for each province.
Now, there is a big difference between being open and operating at full capacity. I believe at best most of the factories (even if they were operational) were working at 75% capacity in March. Not much will change for April.
China may be opening internally, but who will they sell to considering much of the consuming world is in lockdown?
A further hint that the economy is not functioning at 100% is the enormous glut in Chinese rebar. Rebar is a type of steel used to reinforce concrete structures.
It’s another “alternative dataset” we use at Katusa Research to gauge consumption. You’ll see in the chart below that Chinese rebar inventories have skyrocketed to all-time highs.
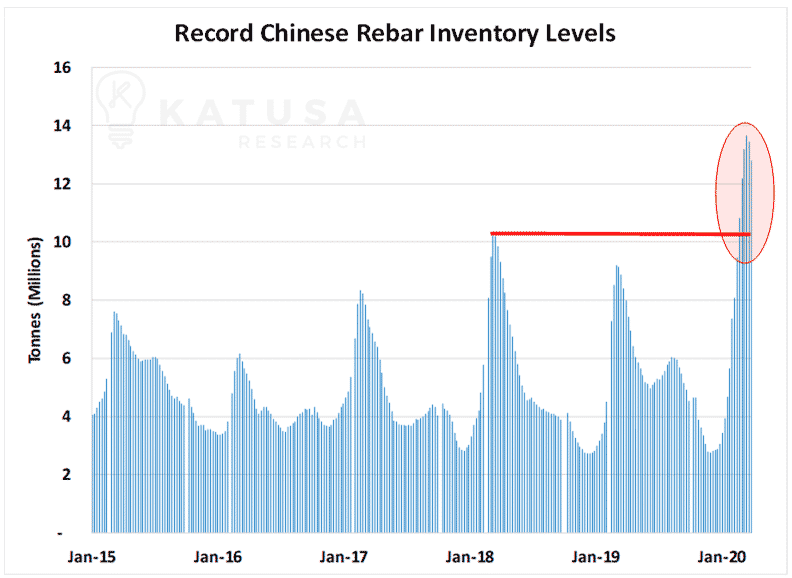
Monitoring these inventories provide an inside look at consumption patterns.
These are the “hidden” indicators that tell the truth of the current state of the economy.
And because so few people follow them, they are less manipulated by the powers to be.
The reason for the pattern is because it’s very difficult to completely idle the furnaces that produce steel. Clearly there is a disconnect between buyers and sellers right now.
If buyers were hungry for steel, inventory levels would not be building.
- Given inventories are rocketing to new highs, this is bearish for steel consumption and general economic activity.
The heartbeat of China is its manufacturing sector. When manufacturing slows down, the entire country comes to a halt. The coronavirus forced many of the manufacturers in China to at least temporarily halt production.
What’s The Worst That Can Happen? Because It Probably Will
It all comes down to how long the factories run at less than 100% utilization. The faster the recovery time, the less GDP growth will be affected.
- The worst-case scenario includes shutdowns for the Chinese Lunar New year, plus an additional five days of 0% factory utilization, thirty days at 50% capacity and forty-seven days at 100% capacity.
- The base-case scenario includes shutdowns for the Chinese Lunar New Year, an additional fifteen days running at 50% capacity, and then sixty-seven days at 100% capacity in Q1.
The best-case scenario includes shutdowns for the Chinese Lunar New Year and then straight to 100% utilization for the rest of the quarter. Through government imposed shutdowns, and big build ups in steel and copper inventory the likelihood of a “best case scenario” is impossible.
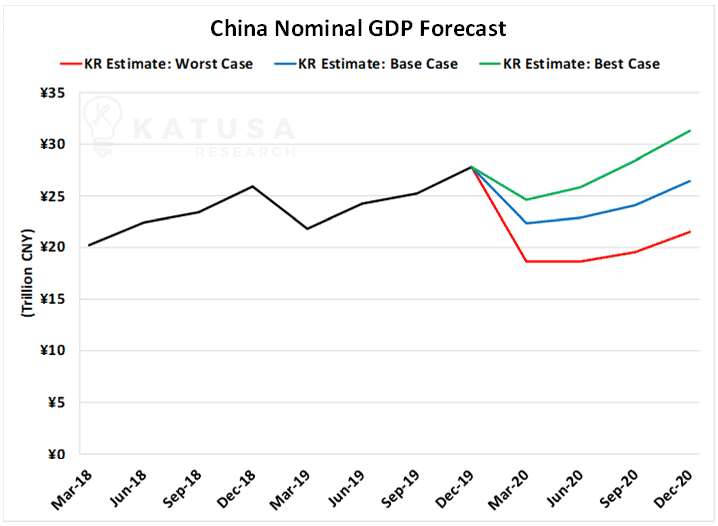
- Based on these estimates, I think Q1 GDP will be at the lower end of between ¥6 trillion and ¥24.6 trillion.
While I believe the Q1 data will be very weak, the government of China will likely put their stimulus machine into overdrive for the remainder of the year.
And you can guarantee they will juice their numbers to the max, meaning you can take them with a grain of salt.
I think it’s logical that the Chinese government will loosen interest rates and lower reserve ratios in efforts to stimulate demand. I could see fiscal aid packages coming as well.
This is a “Too Big to Fail” Situation for China
While this paints an ugly picture for the first three to six months of the year, the significant Chinese government stimulus coming will make the second half of the year and 2021 very robust for base metal demand.
But the U.S. will also do “W.I.T”- Whatever It Takes. Meaning trillions in stimulus is coming.
What the markets are showing you is that investors will flee to yield, meaning paying incredibly high asset prices for low yield.
- Passive investment funds will flock to large and liquid companies that have solid cash flows and dividends.
That’s why you’re seeing multi-billion dollar companies trading like gold juniors right now.
My subscribers and I just bought a major +$15 Billion EV company I consider one of the best in the business. All Katusa subscribers have now taken a Katusa Free Ride on the company (it doubled from our entry price) and are now collecting +10% yield at NO risk.
Our second company recommendation for March is also up significantly, we’re collecting +6% yield and expect to take a Katusa Free Ride shortly.
I wrote about these as part of 5 companies I wanted to own at incredible prices in my premium research service, Katusa’s Resource Opportunities. We sold it for a free ride and will collect a supercharged dividend for years and years to come.
If you’re an alligator investor and have prepared for this you will do incredibly well through this market turmoil.
While everyone else is fleeing world-class companies selling for fire sale prices to meet margin requirements, you will look back in a few years and be very happy with the positions you’ve taken.
Everyone wants to be a contrarian until it’s time to actually step up to the plate and take a swing.
The key is to be prepared with the analysis in hand. That’s what we do and it’s exactly why March 2020 was one of our most profitable months ever.
Personally, as I have been writing for a long time in my newsletter, I’ve been heavy in cash for a long time… waiting for the right opportunities with odds stacked in my favor.
And now it’s showtime.
Regards,
Marin Katusa
