***Every week, the agency that oversees the U.S. futures market (the CFTC) releases a report that shows how companies and hedge funds are positioned in the futures market.
This report is called the Commitment of Traders (or COT for short) report. Various participants with various goals come together in the futures market.
You have producers (like farmers and oil companies) selling their production. You have users (like big food companies and manufacturers) buying raw materials. And then you have speculators (both large and small) who are simply looking to trade the market for a profit. The regulators categorize these participants, track their positioning, and distribute the data.
Right now, the COT report for the gold market indicates we could see a powerful gold rally soon. Here’s why…
My team and I like to watch the relationship between large speculators and producers and users of a commodity (often called “commercials”). The commercials deal in their market every day. It’s their business. Farmers know the corn market. Copper miners know the copper market. ExxonMobil knows the oil market.
Most of the speculative money in the futures market is managed by computerized trading systems. These systems buy markets that are trending higher and sell short markets that are trending lower. This “trend following” money tends to group together and tips heavily to one side of the boat at market extremes.
***In the futures market, every short position has an offsetting long position. So, when hedge funds are extremely short a market, it means the commercials are extremely long (and vice versa).
While I never trade on COT data alone – and no indicator is perfect – I do take note when trend following hedge funds are all betting in one direction. It can indicate an extreme in market sentiment and a potential opportunity. The market loves to punish the speculative crowd.
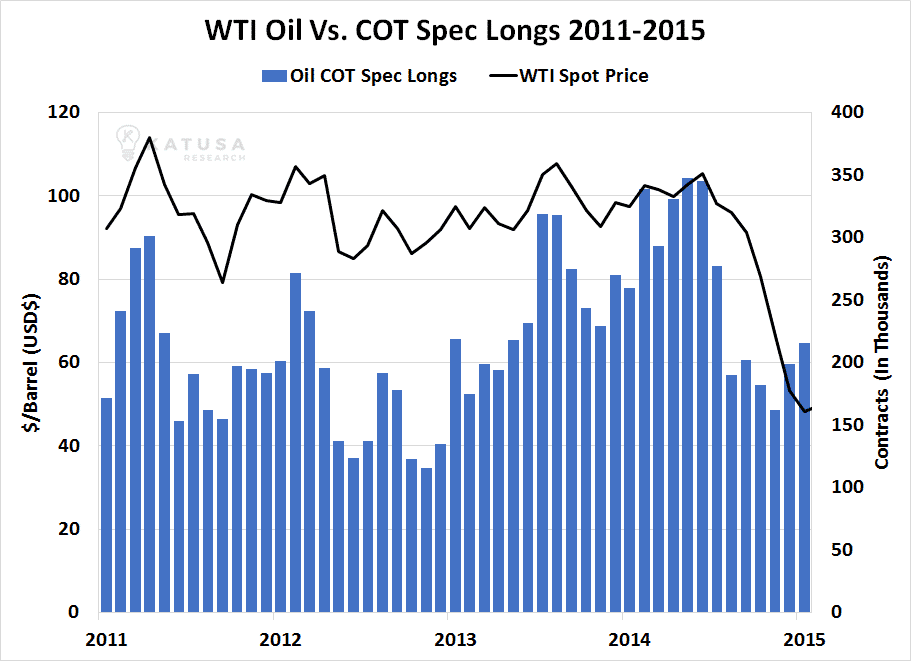
For example, in 2014, hedge funds made near-record amounts of bullish long bets in crude oil. The commercials took the other side of that bet. As increased U.S. shale production flooded the market, oil prices crashed and many hedge funds took a bath.
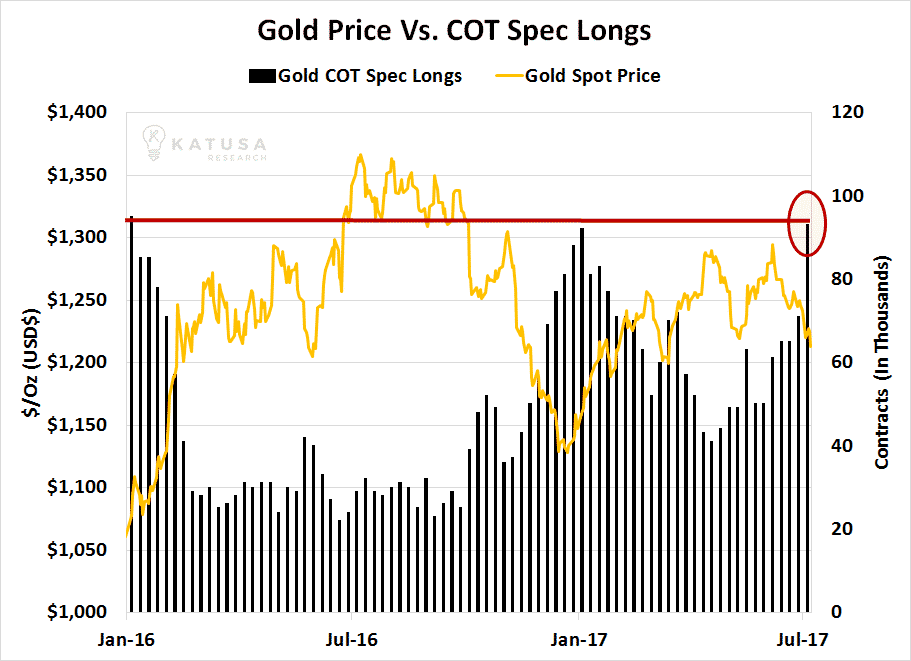
***Based on COT data, we may be about to see a rally in the gold market.
Below is a chart that displays the short gold positions held by speculators (the hedge funds) since 2015. As you can see, they are high right now. You’ll also note that when speculator bets against gold got this high in the recent past, gold enjoyed strong rallies.
Again, I don’t trade based on COT data, but it often signals turning points in the commodity market. I’m not a full-time chartist, but anyone can look at the chart of the big gold stock ETF (GDX), see how it’s been bouncing at the $21 – $21.50 per share level.
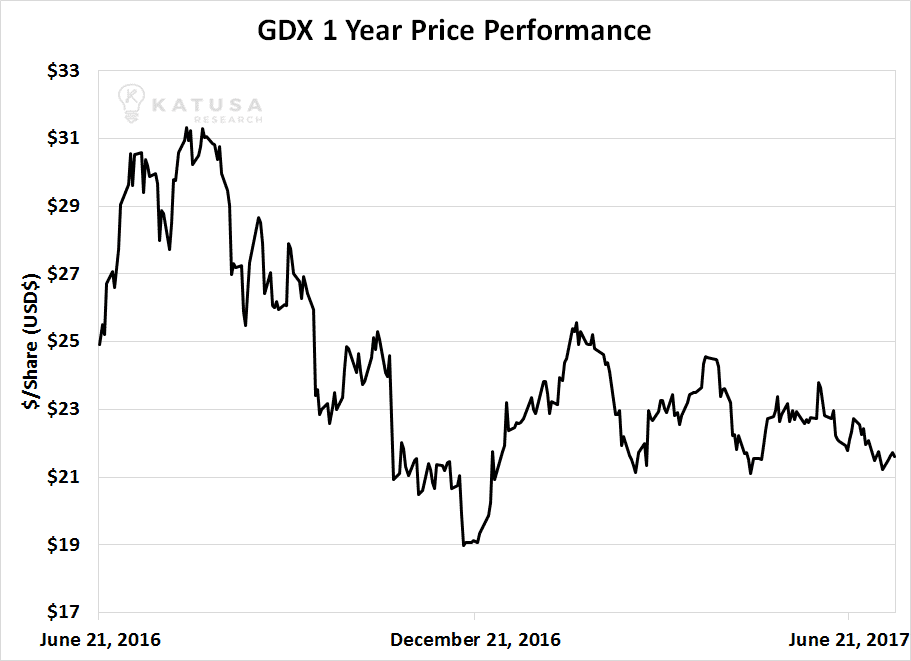
***If you want to bet on a gold rally, you can buy gold stocks here and set a very tight stop loss near the $21 – $21.50 level. If gold rallies, GDX could easily go back to its February level in the $25 range (and higher). If gold sinks instead of rallies, you lose a very small amount. This is the sort of risk/reward profile that top short-term traders like to see.
This is not a trade recommendation from Marin Katusa. It’s simply something interesting that I’ve noticed… and something some very smart traders are watching right now.
Don’t place anything like the trade I’ve described if you’re not comfortable following a trading plan or unable to cut losses quickly.
***Paid up members of Katusa’s Resource Opportunities know we are in “stalking mode” right now in the oil market. Oil is down substantially from its yearly high of $55 per barrel. Oil and gas stocks are down big… and many are trading near 52-week lows.
Dividends are being slashed. Exploration budgets are being slashed. Executive bonuses are going to be slashed. Blood is starting to run in the streets of the world’s oil capitals like Houston (United States), Calgary (Canada), and Dhahran (Saudi Arabia).
Many offshore drilling stocks, which operate in the highest-cost sector, are down more than 70% from their 2017 highs.
When I see big losses and negative sentiment like this, my contrarian, bargain-hunting antennae go up. I start paying more and more attention to my spreadsheets and financial models. In the oil patch, I’ve created a short shopping list of premier North American assets I’d love to buy at bargain prices.
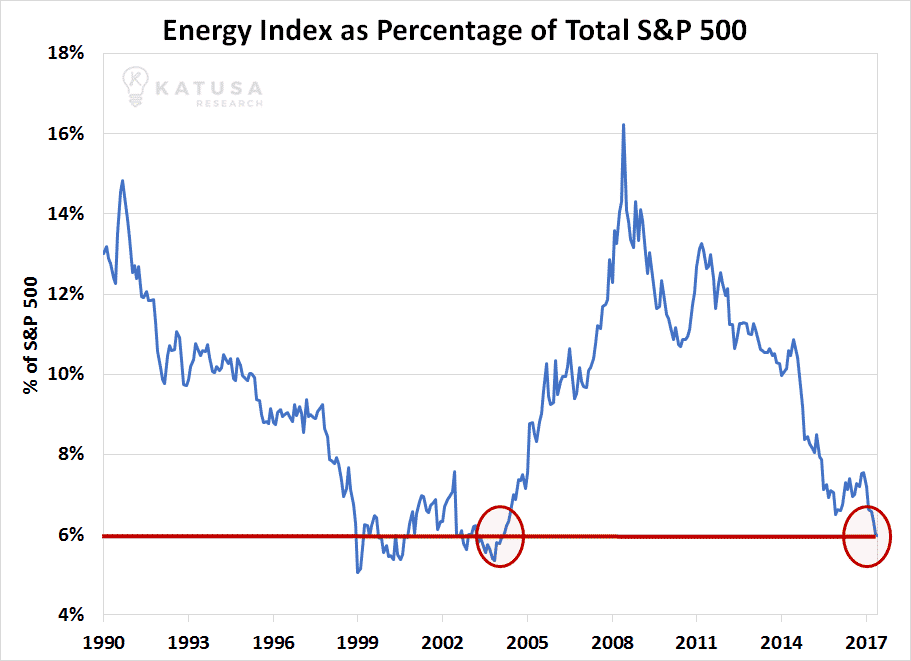
We haven’t started buying yet. I believe there’s more pain to come in the oil and gas sector. But I wanted to pass along the chart below, which shows how the energy sector’s weighting in the benchmark S&P 500 index is at its lowest point in 13 years. It’s yet another indicator that energy is extremely out of favor with investors… and a big contrarian opportunity is taking shape.
Let other people get in the long line to overpay for Bitcoin and tech stocks. We’ll be shopping in the deserted, bargain-bin oil and gas sector. More to come on this big (but still developing) opportunity.
Regards,
Marin
