When oil is trading at $45 per barrel, the answer for oil producers to the question above is “debt.”
Now that oil is down 18% from this year’s high, debt is a large and growing concern in the oil patch. And if you’re a stock investor, this should concern you too.
That’s because of where debt and equity lie in a company’s capital structure. The people who own a company’s debt are first in line to get paid back if a company declares bankruptcy. The equity owners are last in line. The people who own a company’s debt are first in line to get paid interest before shareholders see a dime in dividends.
Debt is the single most important item on the balance sheet to understand when analyzing a company’s stock.
When a company takes on debt, the debt holders are usually first secured by the tangible assets of the company. In the oil patch, the asset would be the projects…. the oil and gas fields. Along with the debt come many debt covenants, which are basically rules the company must follow to stay in the good graces of its creditors.
If the company for whatever reason breaches any of those covenants, the company is in default. Default means the company must pay back the debt or renegotiate with the debt holders. Either way, the shareholders get screwed.
In the oil and gas sector, the pattern over the years has been almost like clockwork. Management teams take on massive amounts of debt when oil is doing well. Big name brokerages and banks “advise” the management teams how this makes sense, the bankers get their fees, the management teams get their money via the debt package and the debt holders get security on the asset and collect a high interest rate that they couldn’t get elsewhere. The shareholders get shafted.
Not Katusa Research subscribers.
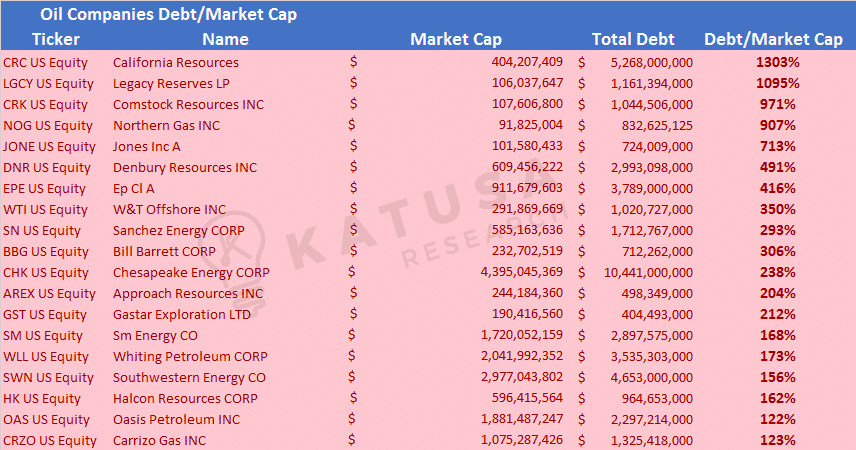
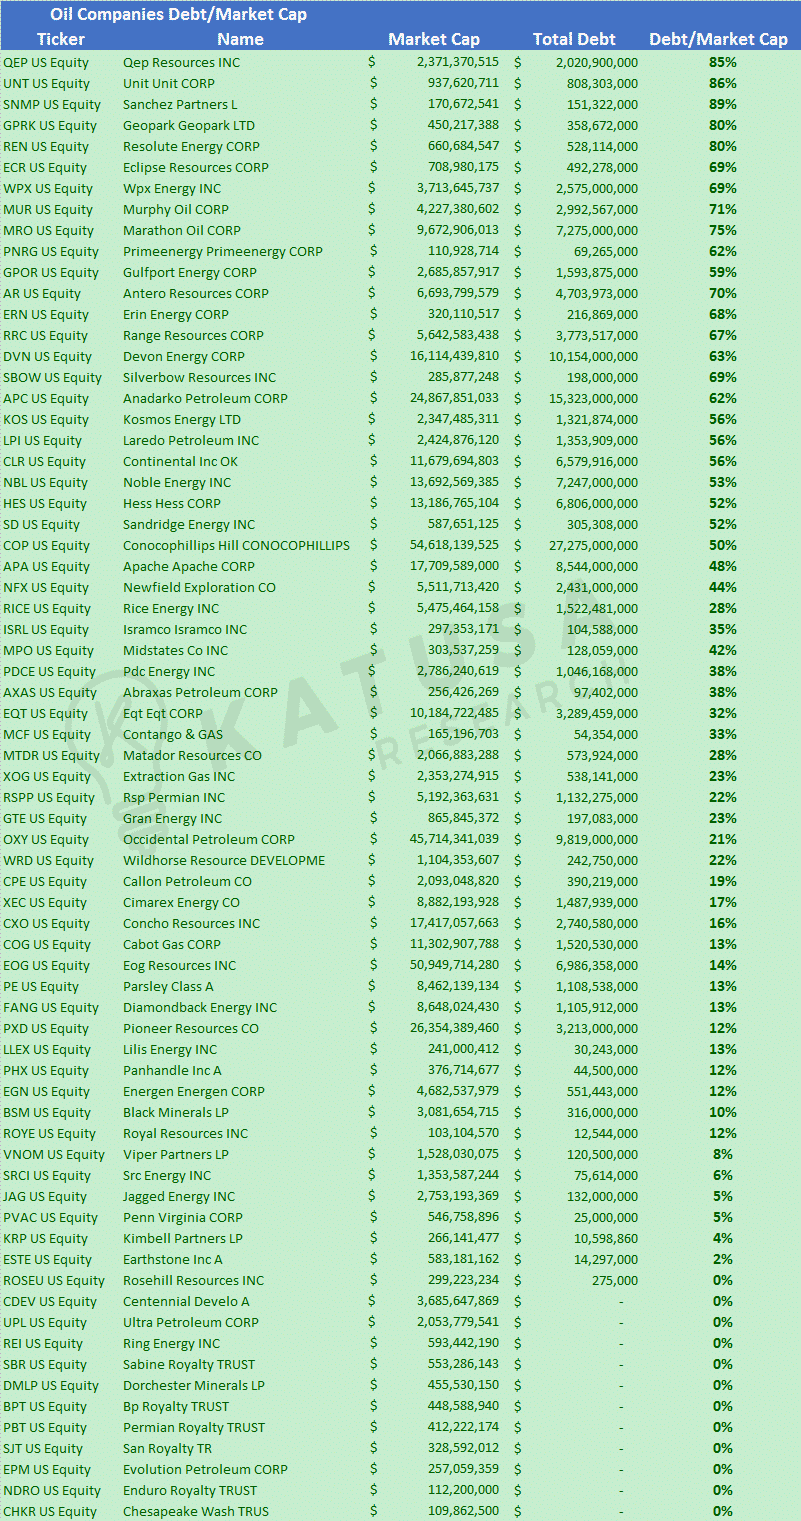
The table below shows the publicly-listed U.S. oil producers that have total debt exceeding their market caps by more than 100%. Debt to Market Cap is a simple ratio that shows how much more debt the company has compared to its market value. As you will notice, the “hot red” color is intended to act as a signal to stay away from these companies.
For example, California Resources has $5.268 Billion in debt. Its market capitalization is just over $400 Million. The debt was taken on expecting higher oil prices, not lower. If the company breaches any covenants, the debt holders will be first in line to get paid. The shareholders will be the last. Debt comes before equity. Please remember that when you are looking at speculating in any company.
Extend and Pretend
In the oil patch, there is a saying, “Extend & Pretend.” This means oil companies and their bankers know that debt covenants will be breached and the debt will be in violation of the original agreements.
But in almost all cases, the debt holders don’t want to take over an asset in a bad oil price environment. Hence, the company will have some room to negotiate, “roll over” the loan, extend the debt, and pretend everything is OK. The corporate managers keep their lofty salaries and bonus packages. The bankers collect more fees. The debt holders keep getting paid. The shareholders lose.
All is not Lost
The below table shows the exact same thing, but of companies with below 100% Debt to Market Cap ratios. Does this mean the companies below are safe? No. But what it does mean is the management teams of the companies below have much better discipline than the managers of the companies in the list above.
One important key to being a good oil analyst is not to waste your time, especially on companies with bad financials and debt happy management teams.
Debt happy is a term that I use for management teams that believe debt is a great way to grow. It usually isn’t in the resource sector, especially when a company takes on too much debt and the price of oil turns negative after the debt is taken on.
There is over $200 Billion in debt outstanding right now in the U.S. oil patch.
But more importantly, the debt taken on between 2012 and 2015 will start to mature soon (meaning it either needs to be paid—or renegotiated). That means there will be many companies coming up against the oil debt wall.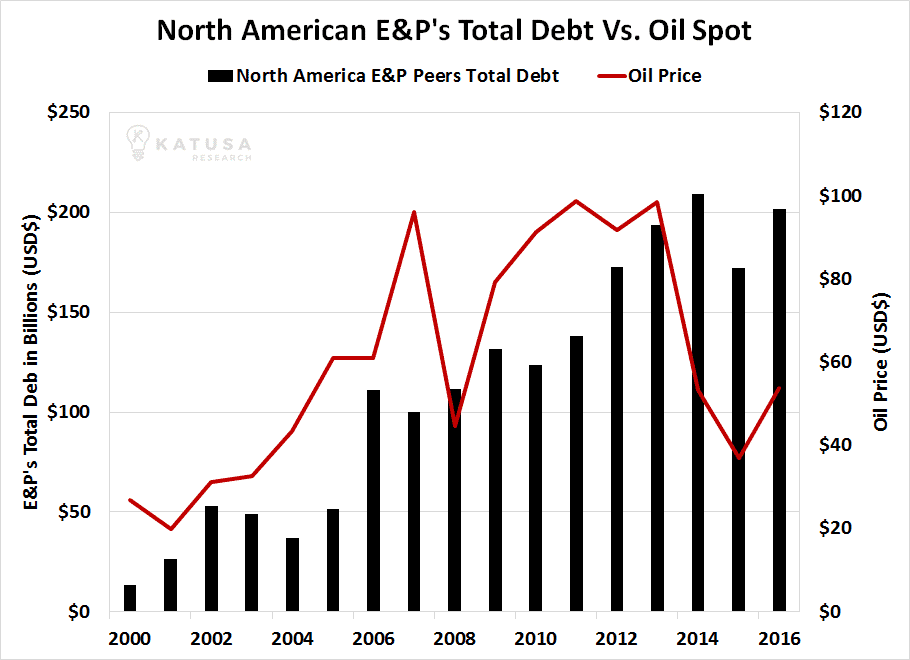
The Oil Debt Wall—The End Result
Next year, the oil companies are going to have to start paying back the debts they took on from 2012 to 2015 (a time of high oil prices).
Not all the debt lenders are stupid, and they realize that in 2018, the U.S. oil patch has almost $25 billion in principal payments to make (which many will struggle to do so). One year later, another $25 Billion is due. And then by 2022, the principal payments will balloon to almost $60 billion, not including the previous interest payments.
It doesn’t take a genius to figure out that the lenders who are due their payments in 2018 & 2019 will probably decline to renegotiate the terms of the debt. They will want cold hard cash paid back to them.
Why? Because there is so much debt due to be paid back to the lenders in 2020, many of the companies who took on debt expecting plus $75 oil will not be able to make their payments in 2020 and beyond. The debt holders know this. They do not want to foreclose. They do not want to own assets in a low oil price oil environment, nor do they want to operate the oil fields. So, the debt lenders want to extract as much cash as they can before the big debt year pay backs of 2020 when the big debt wall facing the oil patches come due.
And for the first time this cycle, the oil executive’s dependency on the option of relying on the lenders willingness to “Extend and Pretend” will no longer be an option in many cases.
That means reality will hit the oil patch. The oil companies will breach their covenants and carnage is coming to the oil patch near you. Shareholders in those debt-heavy companies will lose most if not all of their equity value.
Alligators in the Oil Patch
And this is when the alligators show up.
To be a successful oil speculator, one must understand the natural volatility and cyclicality of the oil business. Please read my essential paper: The Way of the Alligator.
There will be major consolidation in the sector. The smart management teams will use the washout as an opportunity to buy the best assets that were mismanaged by previous management teams at discount prices. That is the Way of the Alligator.
That is how you make money in the resource sector. Buying the lowest cost quartile, highest quality assets during times of sector-wide distress at discount prices is how fortunes are made.
I have my eye on a few of my favorite names in the U.S. oil patch I want to put my money into. But first, I will let the natural cycle and produce a blow up. It’s happening as we speak.
Katusa Research subscribers will have all the knowledge and information they need to be the smart buyers instead of the desperate sellers. More on this to come.
Regards,
Marin