
My office is right in the heart of Vancouver’s financial district above an exchange where you can get dollars, gold or most any other international currency. Directly across the street from me is the old Vancouver Stock Exchange.
From here, the hub of the global junior resource market, I am as close to the action as can be. All major Canadian banks are within walking distance. As are the major brokerages and investment banks.
It’s my belief you need to be where the action is if you want to be involved in the hottest new mining and venture deals – especially in the early stages. I love being in the trenches and especially love being first to a story.
But sometimes, you need to look at what’s outside the trenches in order to solidify a thesis. For me, this means taking a 30,000-foot view of the global economy.
It’s important to know what’s happening at the top level to help guide your investment decisions at the micro level.
The Global Economy from a Momentum Macro View
Below is a heatmap which shows the economic momentum of major nations and trading zones. This economic momentum is calculated using a variety of indicators such as Gross Domestic Product and monetary and fiscal policy, along with national indicators of economic productivity and sentiment.
The red boxes indicate months when economic momentum was below the 12-month moving average. The green boxes indicate months when economic momentum was above the 12-month moving average.
Judging by the amount of red on the right side of the table, it’s safe to say that most of the developed countries in the world have recently seen a slowdown in economic conditions.
Let’s take a deeper dive.
The Global Economy Through the Eyes of Manufacturers
The Purchasing Managers Index (PMI) is a solid gauge for economic activity. The PMI index is a monthly factual survey from participants in the manufacturing and service sectors.
Below is the Manufacturing Purchasing Mangers Index for the United States, China and the Eurozone. A number above 50 is positive and indicates economic expansion, whereas a number below 50 indicates economic contraction.
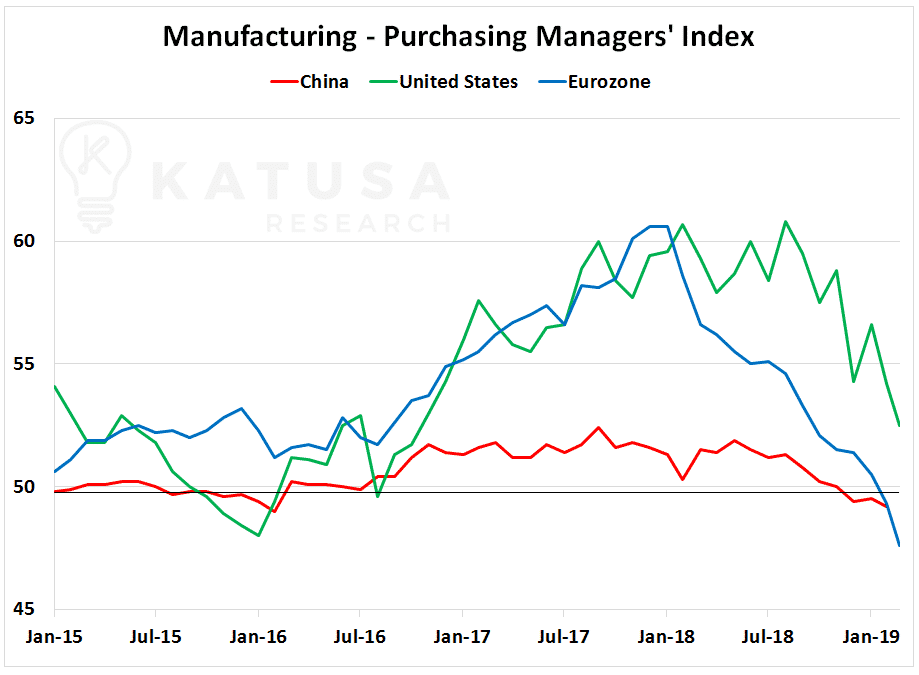
Manufacturing and service sectors are the lifeblood of the economy. You’ll notice that each of the PMI Indexes has been taking a nose dive. China and the Eurozone are now under the 50-mark showing economic contraction.
This isn’t a good sign.
With economic conditions worsening both domestically and abroad, it’s not surprising that the U.S. Federal Reserve continues to backpedal on the number of interest rate increases it’s planning for 2019.
This past Wednesday, the Fed announced they were holding rates constant – which everyone expected. What surprised the market however, was the Fed’s prediction for zero rate hikes for the rest of 2019. This is down from the 2 forecasted increases last year and 1 increase forecasted from the December 2018 meeting.
I can’t say I’m surprised that we’re continuing to see a slowing in the pace of interest rate increases from the U.S. Federal Reserve.
Federal and consumer debt in the United States has soared like stocks in the cannabis sector. The U.S. Federal Reserve knows this. Jacking up interest rates now is the equivalent of a financially tapped out home owner imposing a 19% interest rate on their own mortgage.
Using data from the St. Louis Fed, I’ve charted U.S. government interest payments on its debt versus national GDP.

Since 2004, interest payments relative to GDP have increased from 2% to over 3%.
A 1% increase may not sound like a lot, but I’ll bet a $277 billion increase does.
- That’s the difference between the federal government’s quarterly interest payment in 2004 and its last payment in 2018.
As the U.S. economy stagnates, this debt payment becomes an increasingly larger percentage of GDP.
Given the change in stance from the Fed on future interest rate levels, the U.S. dollar should be front and center on everyone’s radar.
You’ll see in the chart below that the U.S. dollar has been appreciating versus major currencies for the past year. The green line indicates the technical trendline which acts as support.
It has bounced off this line several times. If the U.S. dollar index goes below the trendline, we could see the U.S. dollar head lower against most major currencies.

How Do Steady Rates and a Falling Dollar Affect Gold?
If the Federal Reserve continues along this path of fewer interest rate increases than initially forecast, this would be a positive for gold and gold equities.
Expectations for fewer interest rate increases would cause the U.S. dollar to depreciate, which would in turn cause gold – which is denominated in U.S. dollars – to appreciate.
- Under this thesis, you could invest in physical gold, and make a nice return. But I’m betting millions that the big money will be made in the gold equities.
That’s because those stocks are highly levered to the price of gold. If gold goes up even $100-200 per ounce, I think some gold developers and producers could go up 100% or more.
But the problem is, you need to be careful which ones you pick. Because not all gold companies have been managed responsibly.
I have invested millions into my two top gold stocks. My top stock is testing resistance levels on a daily basis and looking to break out of a tight 14-month trading range. It’s up 41% in the last 3 months.
Three years from now, I can see readers going back and kicking themselves for not owning this stock in their portfolio.
Subscribers to my premium newsletter, Katusa’s Resource Opportunities, already know the name of this company.
It is without a doubt my highest conviction gold stock. And one I’m backing with millions of my own money.
Regards,
Marin
